
Infographic link building is when you create engaging, visually appealing infographics in the hopes of earning high-quality backlinks that boost your search engine rankings.
But you probably know that already. If you’re here, then you’re probably interested in things like:
- Does infographic link building still work?
- How do I build links to my infographics properly and safely?
- How do I do mass email outreach without ending up in spam folders or getting rejected?
- What does a good infographic even look like?
- How do I choose a good topic? Because whatever I’m doing now is not working!
Our team at PressWhizz has been building links for decades, and infographic link building is a high-ROI tactic we come back to time and again during link building campaigns for our clients.
According to our page, 50+ Link Building Statistics for 2026, educational link assets like infographics outperform product pages by 5x in link acquisition.
So, making visually appealing graphics is 100% worth your time.
In this guide, we’re going to cover everything you need to know about building high-quality links using graphics, including:
- What infographic link building is
- Why they work
- If they’re safe
- The different types of infographics you can make and which niches they work best for
- Our own process for building high-quality backlinks
Ready? Let’s begin.
What Is Infographic Link Building?
Infographic link building is a white hat link building strategy where you create informative, visually appealing graphics and promote them to other websites to earn backlinks. In case you are very new to the internet, infographics are visuals that typically present statistics, original research, complex information, or step-by-step processes in an easy-to-understand format.
With infographic link building, you create an infographic, publish it on your website, and promote it to relevant bloggers, journalists, and publishers through email outreach. When another website embeds your graphic in its content, you earn a link from that site to yours (known as an SEO backlink).
So, why do search engine optimization professionals love building infographics and other linkable assets? Because infographics earn high-quality backlinks, drive referral traffic, and drive user engagement (like social shares and comments).
High-quality, hard-to-replicate backlinks are the #1 benefit you should care about, so let’s start there.
Regardless of what Google publicly says, we know from the algorithm leak and recent testimony in the Department of Justice lawsuit that backlinks are a top 3 ranking factor, and our own experience and testing show that links are the most important SEO ranking factor. And we aren’t just saying that because we are a link building marketplace.
It’s simple: Backlinks increase your search engine rankings, and generating infographics and promoting them earns high-quality backlinks.
Here’s an example of an infographic that generated a lot of high-quality backlinks for Search Engine Land:
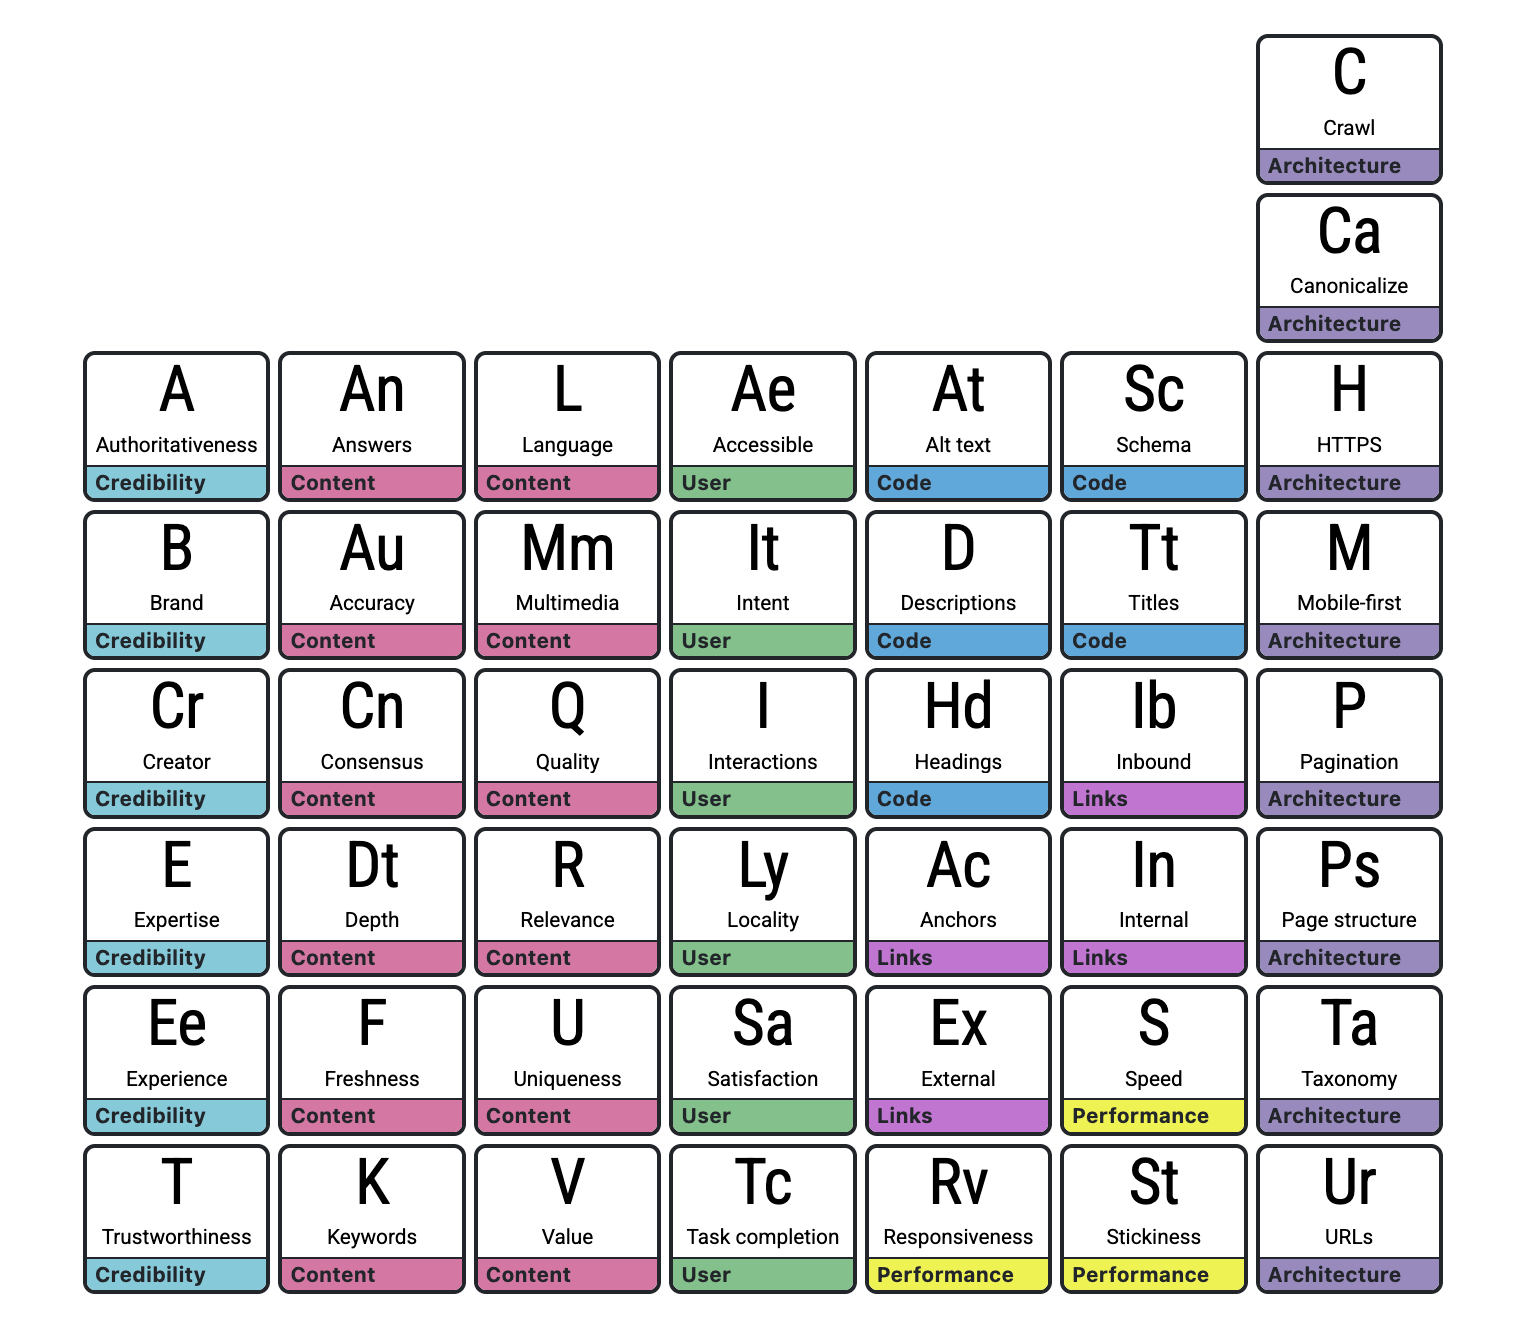
This is an excellent infographic that breaks down different SEO ranking factors into an easy-to-digest visual table.
Guess how many backlinks this one infographic has generated for its publisher?
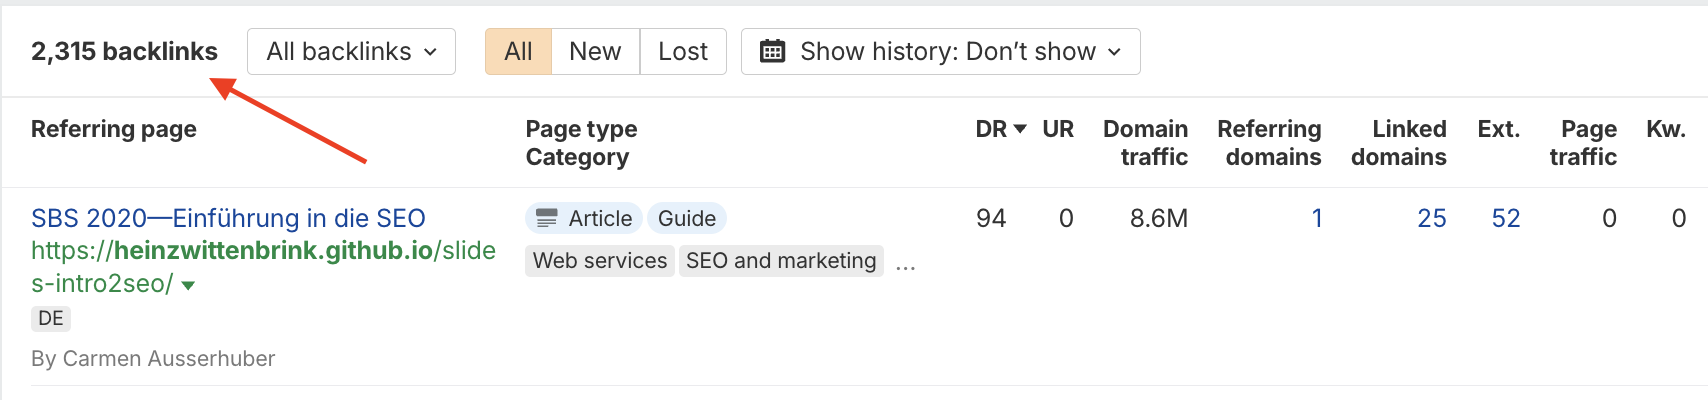
More than 2,300 backlinks. This table probably took all of 10 minutes to create, but it generated thousands of links. According to our own link building pricing report for 2026, the median cost of a link on our link building marketplace was $112. At just the median price, the value of these links would be over $250,000. $250,000 in value for 10 minutes of work. Not bad.
Bottom Line: The main SEO benefit of infographic link building is earning editorial backlinks from relevant websites. These links can pass link equity (also called PageRank…more on this below), which helps Google evaluate the importance of webpages and improves rankings.
Before we get into how to build links using infographics, we need to cover why this type of link still works. It’s important.
Why Infographics Still Earn Links
Infographics still earn links because they package complex information into a visually appealing format that has proven to earn high traffic and engagement from visitors. And that high engagement makes bloggers, journalists, and other content creators want to share it (which earns you a link as the original source).
Infographics have been used for link building since the 2000s, and they absolutely still work.
A good infographic gives other websites a reason to reference your content and link back to you, and those editorial backlinks can pass PageRank (the foundation of Google’s algorithm), strengthen your backlink profile, and improve your organic rankings.
Don’t believe me?
Search Google for:
Site: pinterest “infographic”
You’ll find plenty of examples of infographics being used as linkable assets. Trust us, SEOs wouldn’t be spamming infographics if they didn’t still work!
If you’d like a more concrete example, check out this example from Data is Beautiful on the topic “Who’s Suing Whom in AI?”:
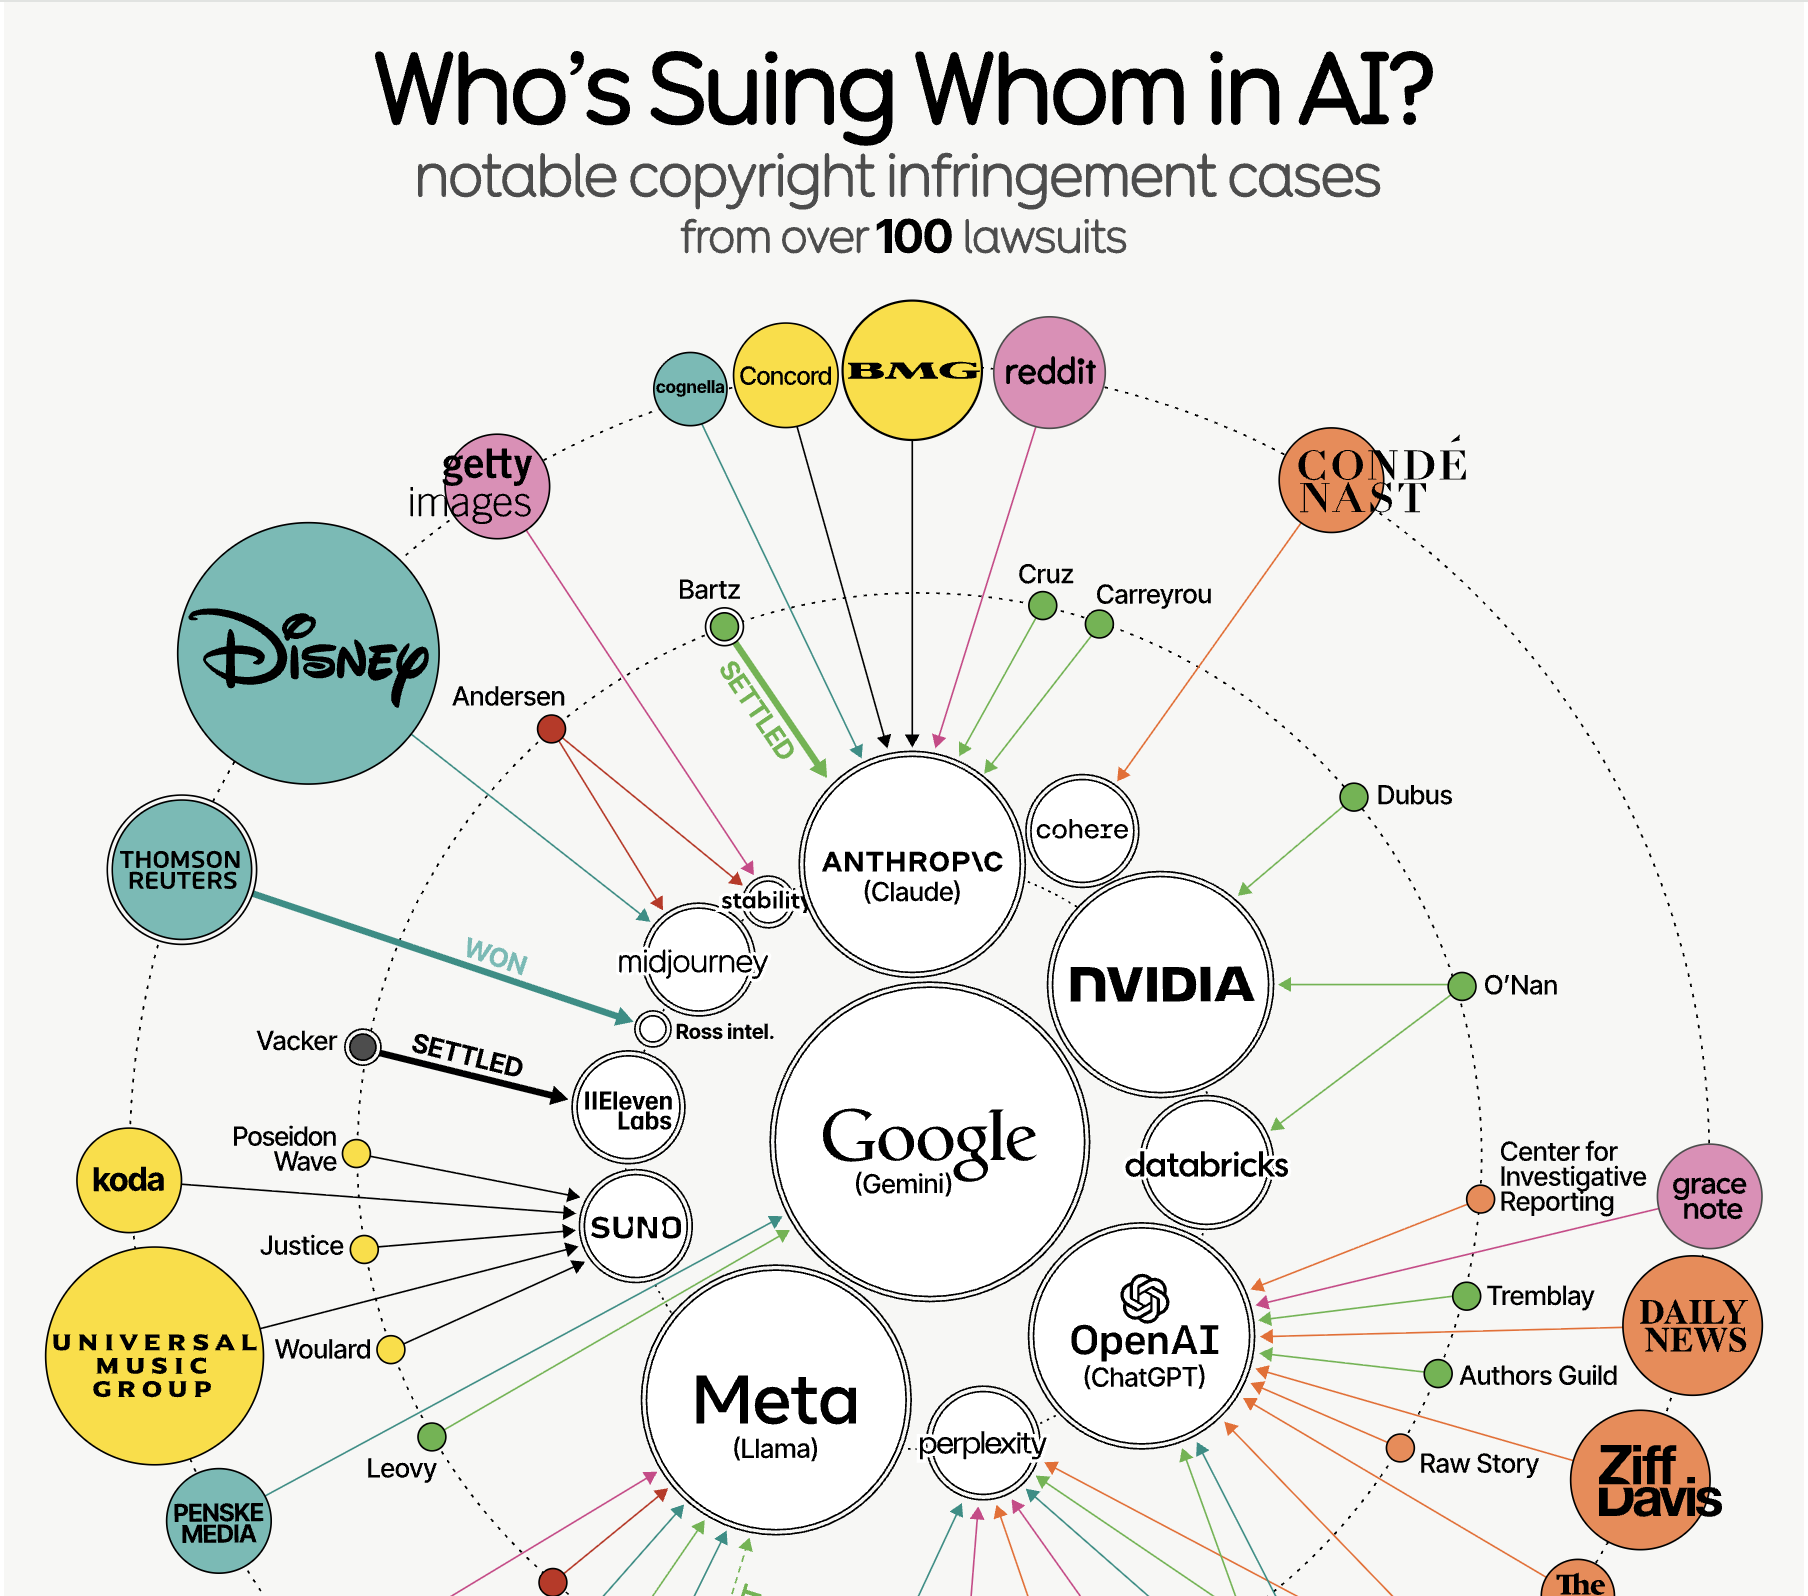
The answer is quite literally everybody. But jokes aside, this recent infographic has earned nearly 300 backlinks for this website. More importantly, many of the links are coming from major news outlets and other high-DR (Domain Rating) websites:
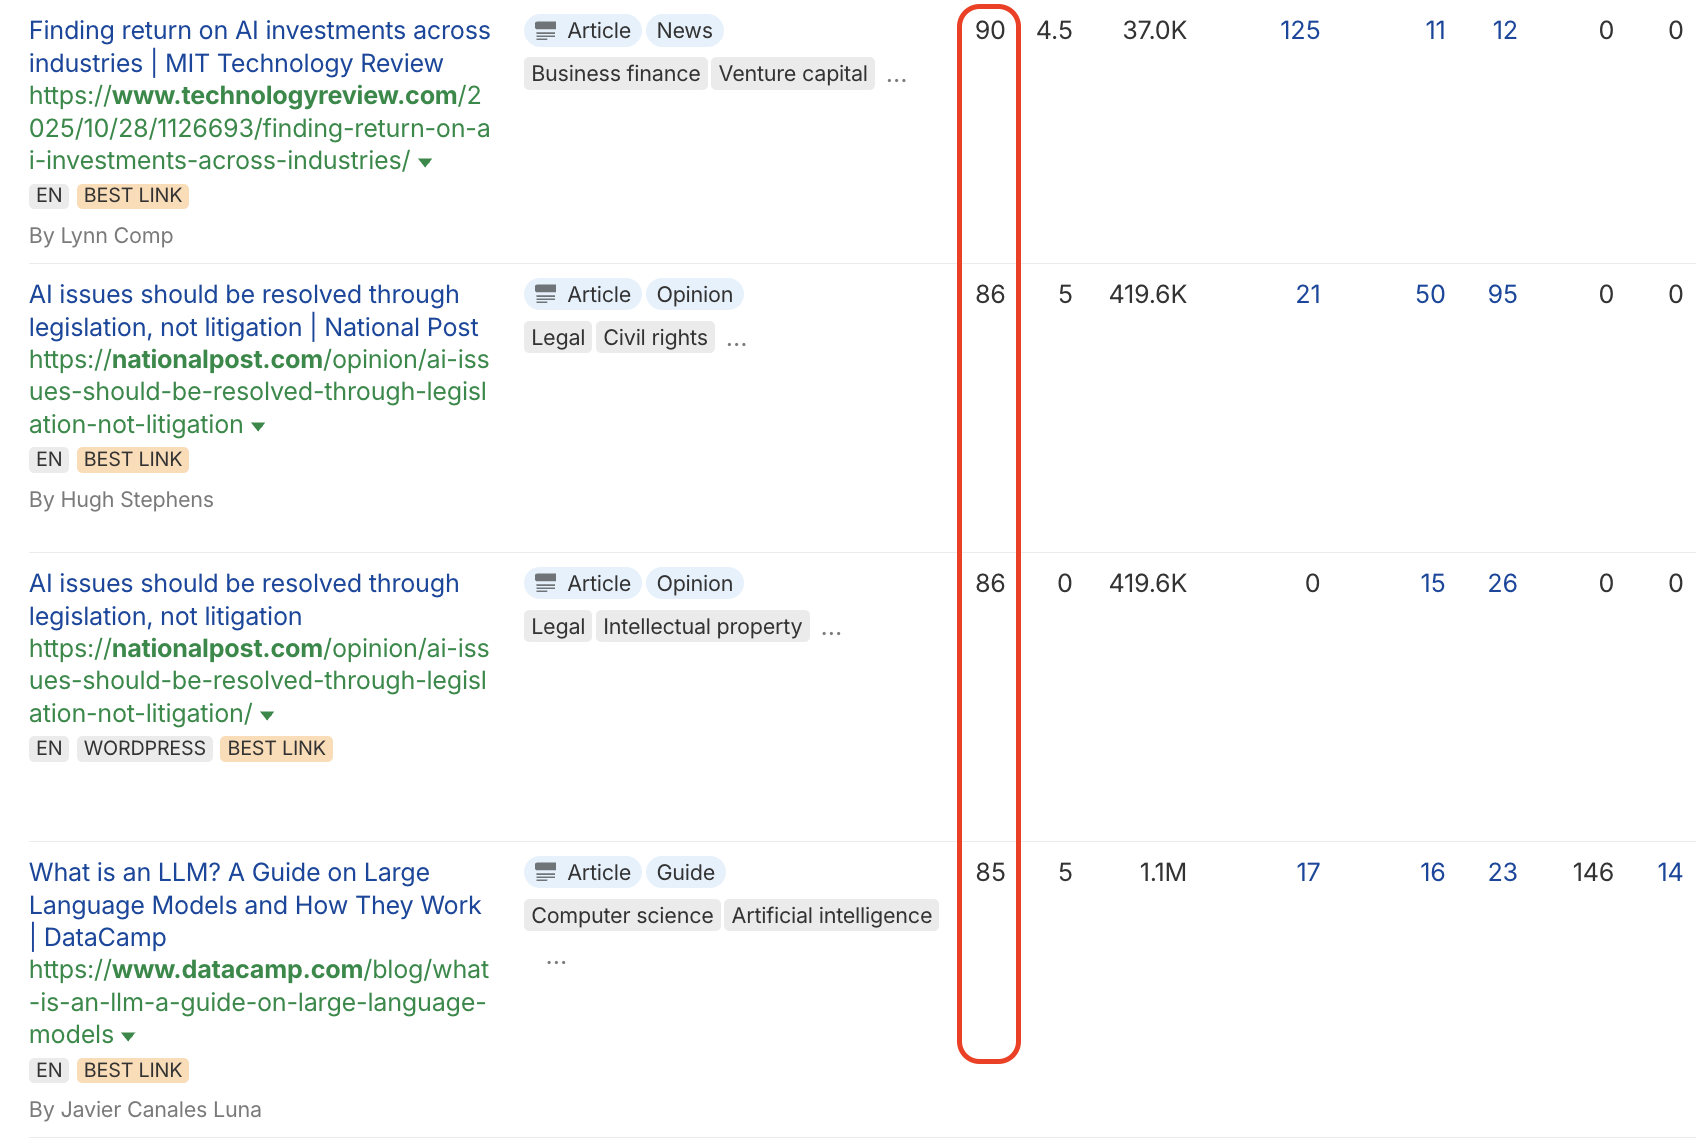
We know that DR isn’t everything nowadays, but these are high-quality SEO backlinks from legitimate outlets. You’d need to build digital PR backlinks to equal this level of quality. And they all came from an infographic that didn’t take much time to build at all.
AI has made creating infographics ridiculously easy. These days, anyone can generate a decent-looking graphic in minutes. So, infographics with recycled stats and 0 originality will get you absolutely nothing (except hate on social media).
Instead, we recommend prioritizing:
- Original research: Surveys, experiments, and proprietary datasets.
- Unique statistics: Numbers competitors can’t simply copy.
- Information gain: Insights and findings that aren’t already everywhere online.
- Useful visualizations: Complex processes, comparisons, and data explained clearly.
- Digital PR potential: Topics journalists and industry publishers actually want to cover.
- Evergreen value: Graphics that remain useful and attract links over time.
Bottom line: Don’t just make something that looks good. Make something worth stealing (and hopefully linking to).
Benefits of Infographic Link Building
Infographic link building improves your organic rankings, builds topical authority, increases brand visibility, and reduces your average cost per backlink, especially when you combine original data with targeted outreach.
Here are the benefits of creating original infographics and promoting them:
- Rankings and organic traffic: Relevant backlinks earned through infographic outreach can pass link equity and contribute to PageRank, which is still part of Google’s core ranking systems. DemandSage reports a 178% increase in inbound external links when blog posts and articles include infographics.
- Lower cost per link: Infographics have upfront research, design, and outreach costs, but the same asset can earn backlinks across multiple campaigns and attract passive links over time. Our PressWhizz Link Building Pricing Report found a median backlink price of $112, which we recommend you use as a benchmark when determining link campaign costs. As you earn more referring domains from the same asset, your average acquisition cost decreases.
- Brand visibility and engagement: When your infographic gets shared on a website with traffic, it attracts relevant visitors who may click through to your site, explore your content, and engage with your brand. This can generate referral traffic, branded searches, and repeat visits, while exposing your content to an audience that’s already interested in your topic. Google uses various user interaction signals in its ranking systems, so interested visitors can create an SEO snowball effect where you get even better rankings over time.
- Topical authority: Infographics built around original research, industry statistics, and proprietary data can attract editorial links from websites covering the same subject. These contextually relevant backlinks help Google understand your site’s relationship to a topic, while descriptive anchor text and surrounding content provide additional relevance signals.
OK, you now know the benefits of infographic link building, what it is, and why it works. The last thing we need to cover before showing you our step-by-step process is the different types of infographics that typically attract backlinks.
Types of Infographics That Attract Links
The most common types of infographics include statistical, informational, timeline, process, comparison, and geographic infographics. Each works better for different types of content and for different niches.
You might not think it matters, but formatting, information type, and layout drastically affect engagement (and with it, whether your infographic outreach works or not). A 2026 study published by the Eurographics Association found that comparison information accounted for 58.5% of variation in readers’ infographic preferences, while graphic type accounted for 29.2%, and color accounted for just 12.3%. If you’re creating statistical infographics for link building, focus on useful comparisons, clear data visualizations, and original findings that other publishers can reference.
Our team has put together a list of the best types of infographics for link building, so you can choose the right format for your content and increase your chances of earning high-quality backlinks.
Statistical and Data-Driven Infographics
People aren’t great at making sense of walls of text, especially when they’re packed with numbers and statistics. But a well-designed statistical infographic? That’s much easier to digest.
Instead of presenting readers with a long list of statistics, use charts, graphs, icons, and proportional illustrations.
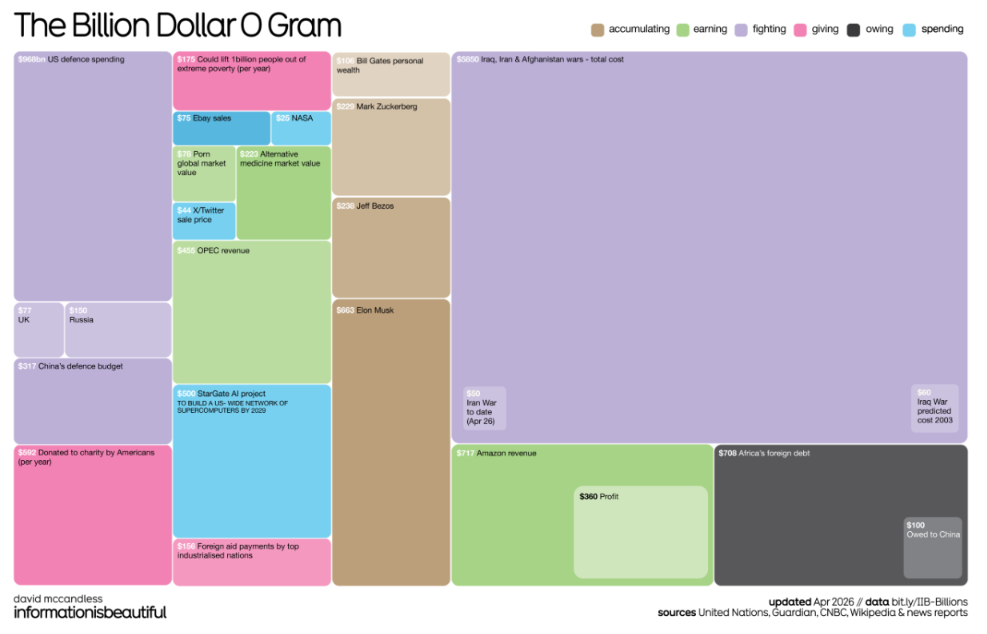
To see what I mean by a statistical infographic, look at David McCandless’s Billion Dollar-o-Gram, which uses blocks to compare enormous financial figures. It puts government spending, corporate profits, national debt, and other figures into perspective (not that we even want to know):
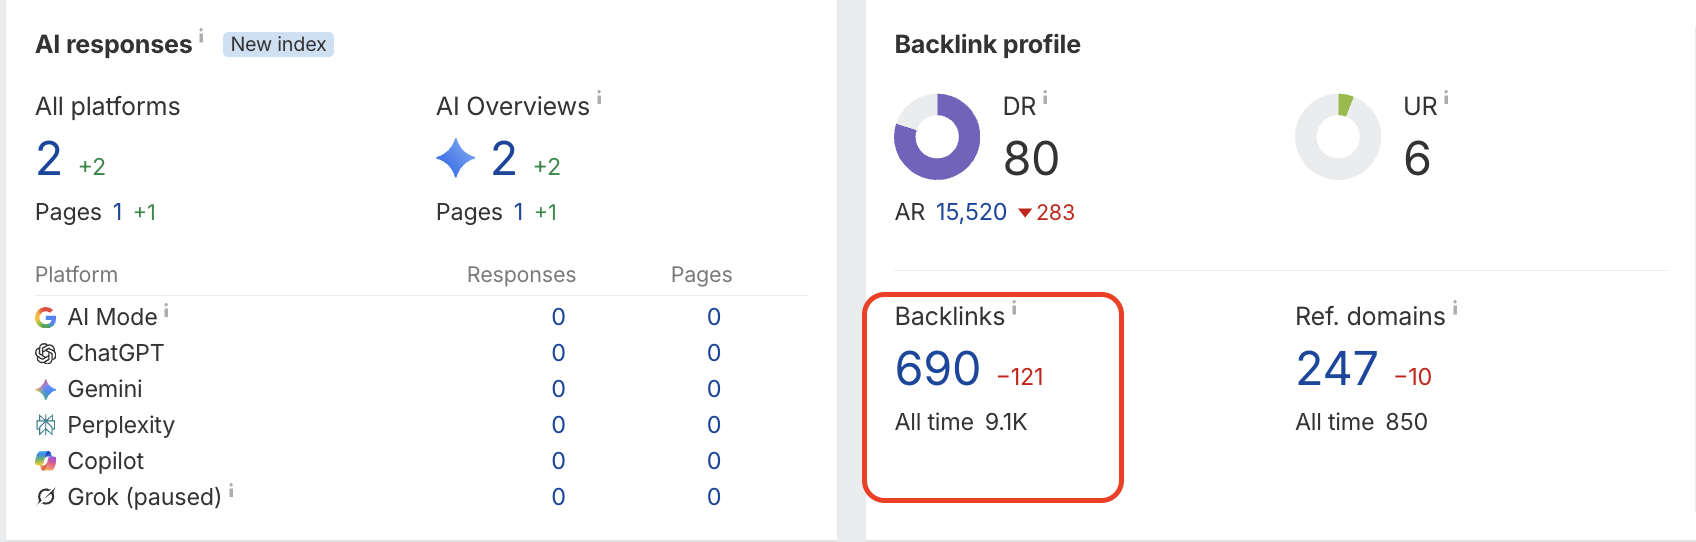
This interactive infographic has attracted thousands of backlinks over time. Even now, it’s currently hosted on Data is Beautiful, and that page has nearly 700 backlinks:
Process and How-To Infographics
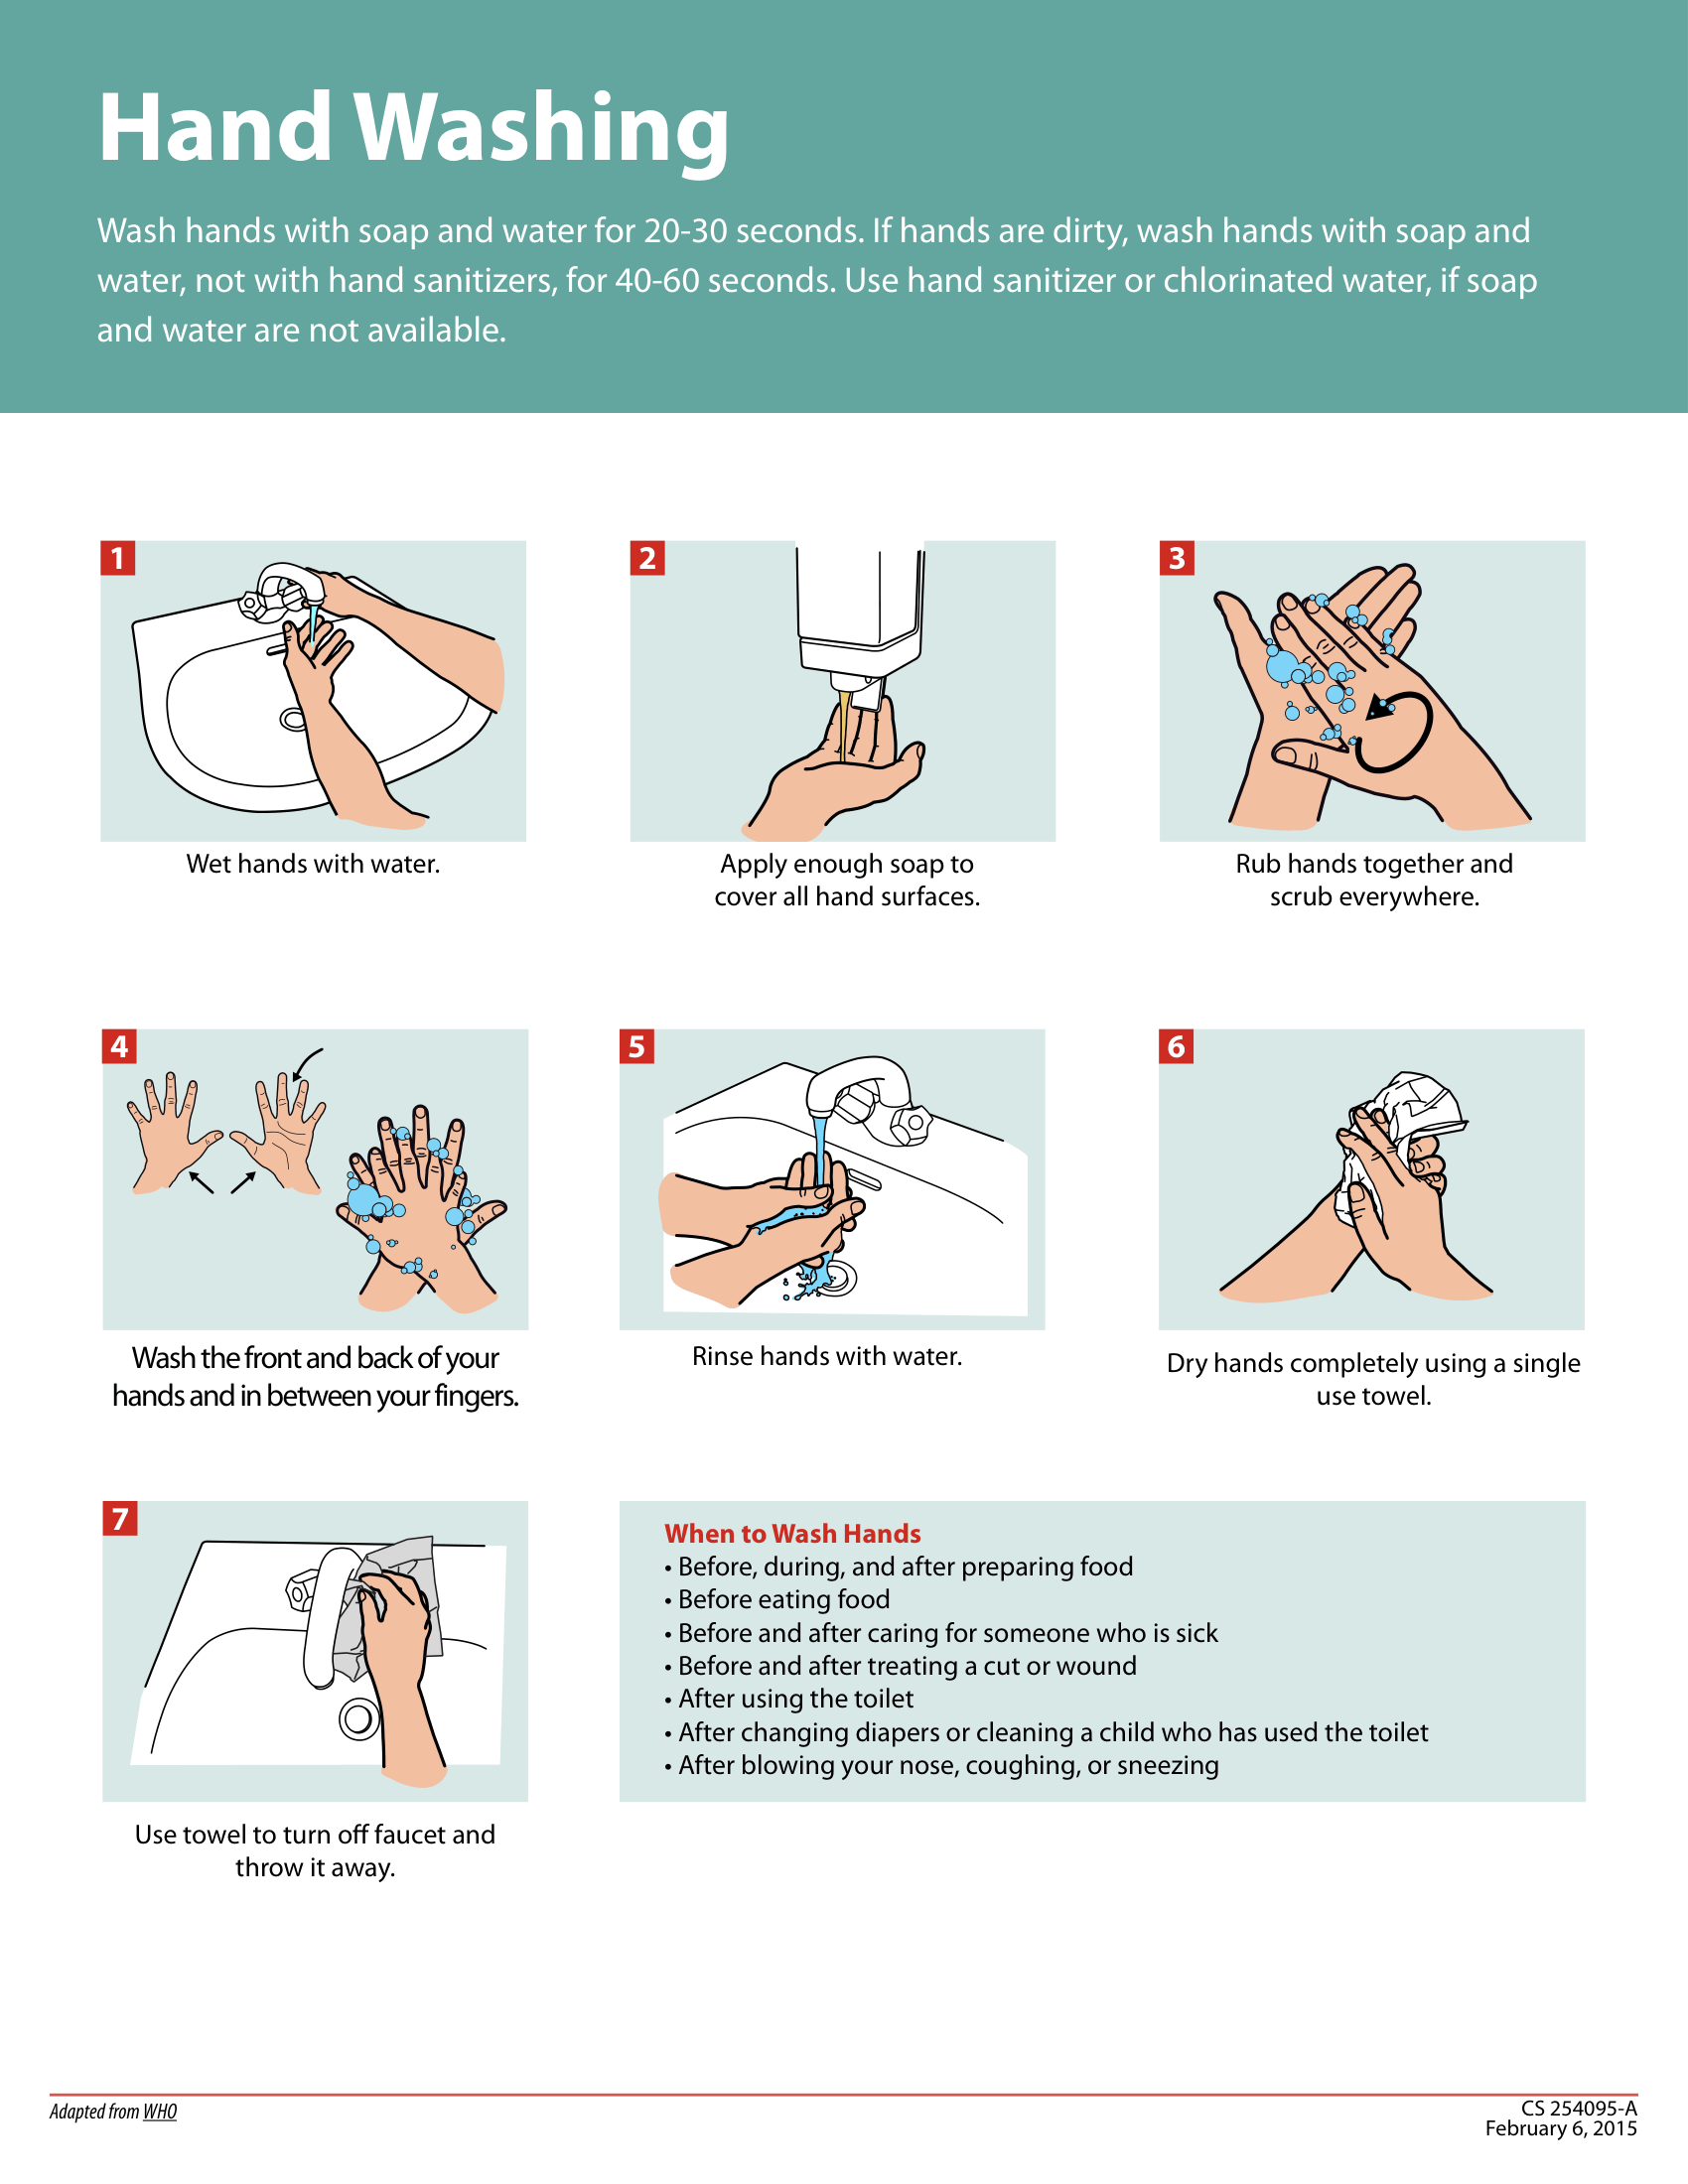
Process and how-to infographics break down complicated procedures into simple, visual steps. They use illustrations, numbered instructions, and short explanations to show people exactly what to do.
Take a look at one of those hand-washing posters we’ve all seen (and maybe grown a little tired of) from the CDC. It’s simple, effective, and gives you a clear idea of what to do, step by step:
It’s crazy. Do people really not know how to wash their hands?
Comparison Infographics
A comparison infographic is an infographic that weighs two items, options, or data sets side-by-side so a reader can easily understand the similarities, differences, and key points of each and how they relate to each other.
For a good example of a comparison infographic, check out our very own mini infographic comparing guest posts and link inserts from our Link Building Pricing Report. You can immediately see that link inserts (niche edits) are less expensive, with an average price of $112 compared to $164 for guest posts. It’s as simple as it gets, but it gets the message across immediately:
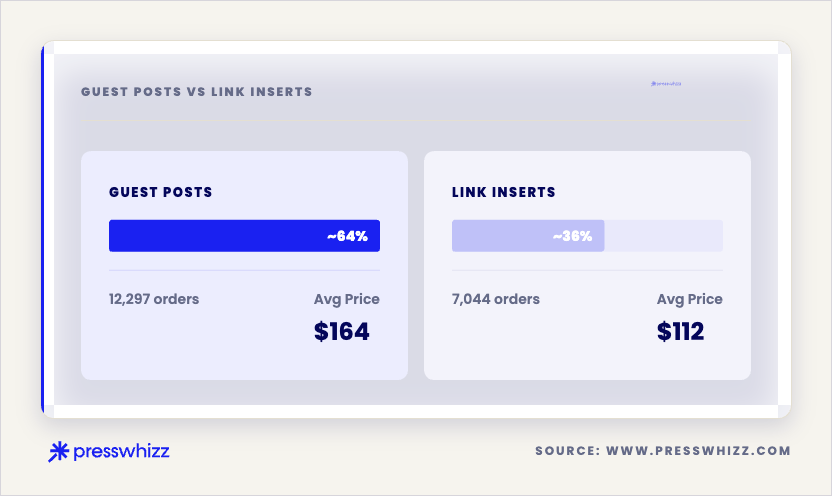
That’s what makes comparison infographics useful for link building. They turn information people would otherwise have to read and interpret into an easy visual comparison. It also makes purchasing decisions much easier. Remember what we wrote above? Comparison infographics are the most engaging form of infographic. When in doubt, default to them.
Timeline Infographics
Timeline infographics put events in chronological order, so readers can easily understand how something develops or changes over time. They can cover anything from a company’s history to major scientific discoveries.
Here’s an ambitious example…
The European Space Agency’s timeline of the universe. It illustrates nearly 14 billion years of cosmic evolution, from the Big Bang and the formation of the first stars to the galaxies we see today.
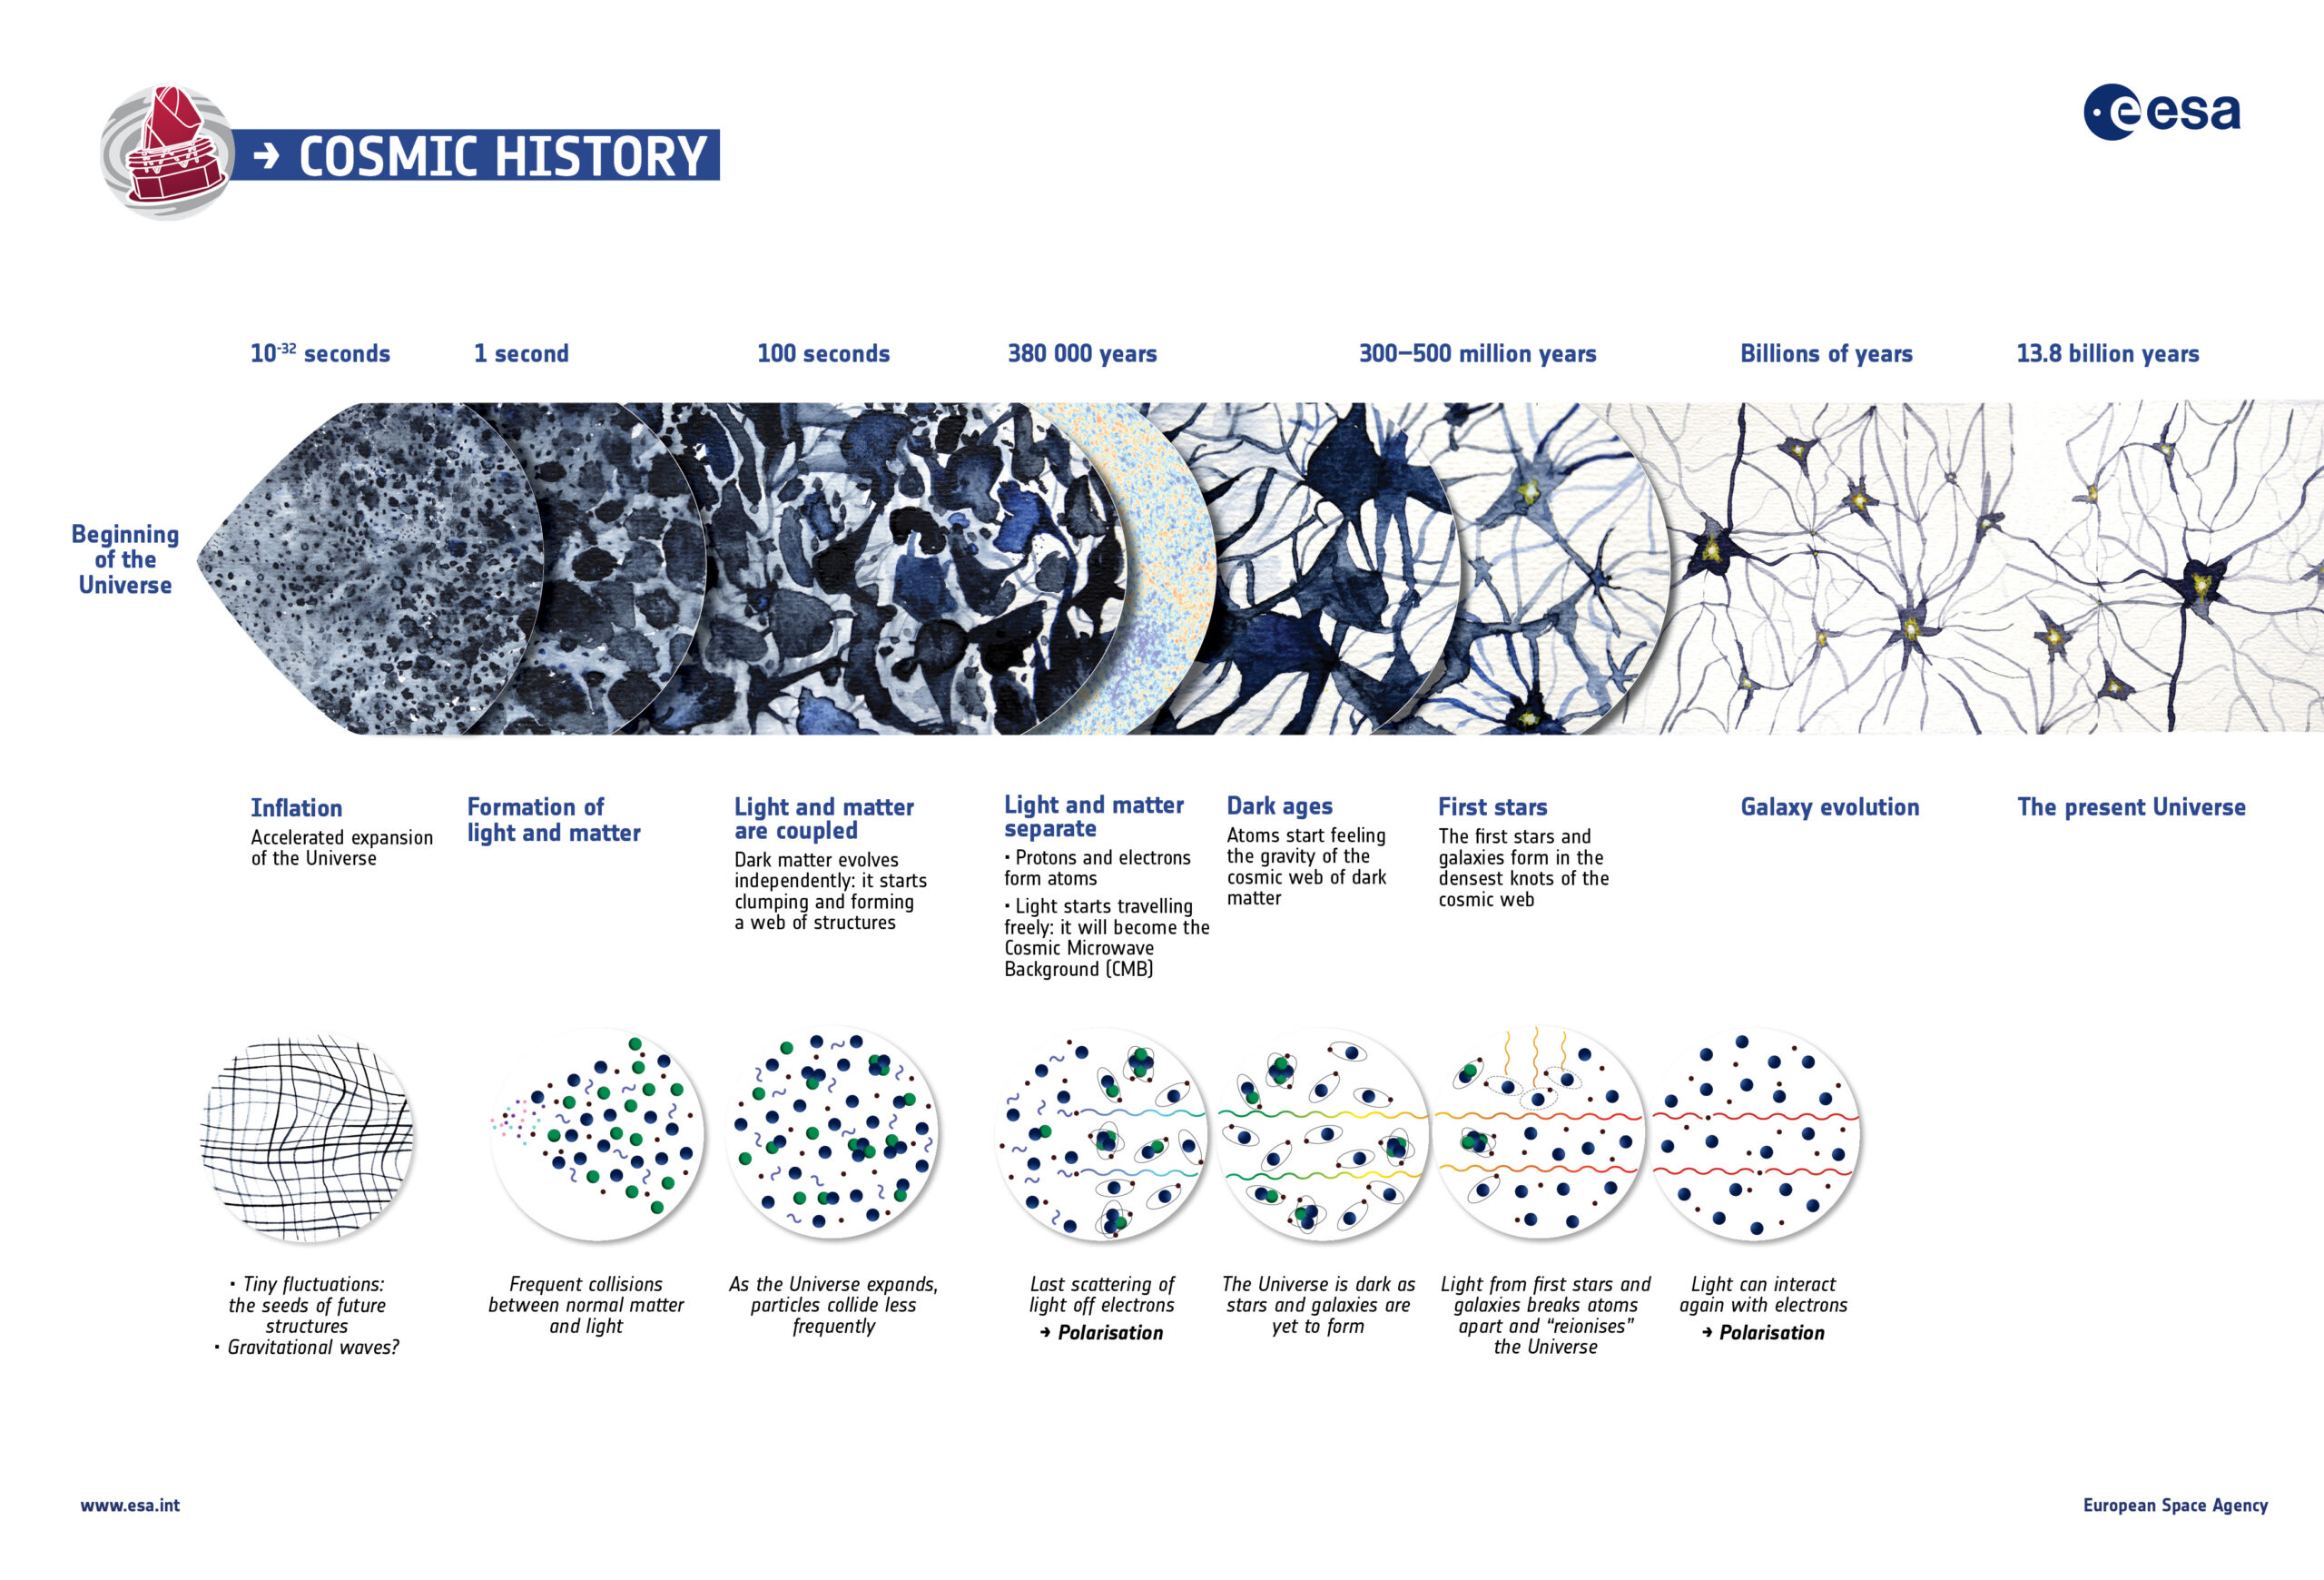
Fascinating stuff. Sometimes we SEOs forget there’s a world outside of Ahrefs and Google Search Console. Apparently, there is, and it’s very old.
We recommend using timelines whenever you need to turn lengthy historical or chronological information into a single, easy-to-reference data visualization.
How to Build Links With Infographics in 7 Steps
Building backlinks with infographics involves the following 7 steps:
- Research topics with strong backlink potential
- Collect and verify data from credible sources
- Storyboard the infographic
- Design your infographic
- Publish and optimize the infographic on your website
- Add an embed code to encourage backlinks and attribution
- Build a targeted list of relevant websites and publishers, then reach out
Below, we’ll share the proprietary process our link building services team uses to build backlinks with infographics for real client campaigns, including our research methods, prospecting techniques, and outreach strategies.
Let’s start with the most important step: Picking a topic.
Pick a Topic With Link Potential
The first thing you need to do is pick a topic that other websites will want to link to. Good topic ideas are interesting, trending, and related to popular topics. Easier said than done…
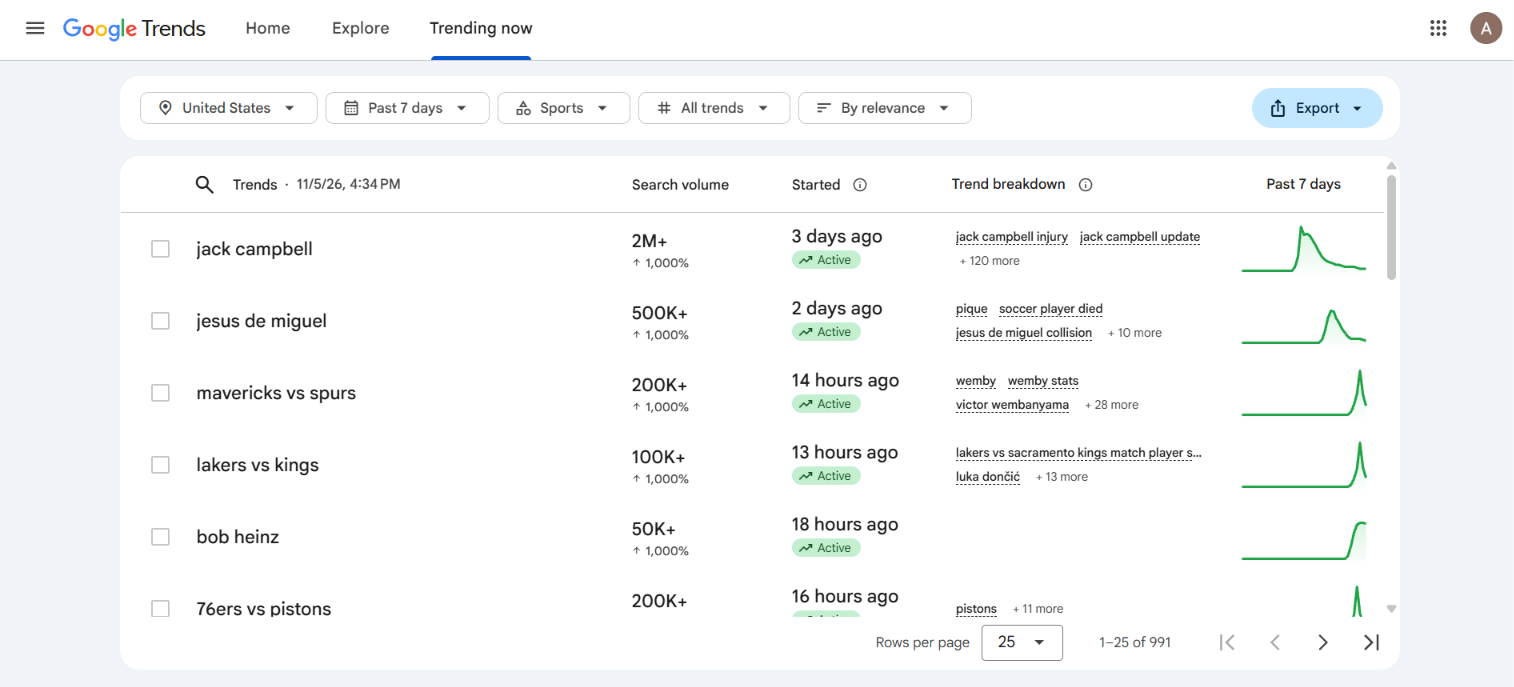
You can do that one of two ways: Exploring topics using tools, such as Google Trends or Ahrefs. Or, just reverse-engineering what’s already working and improving upon that (our favorite).
We’ll cover both.
The easy way is to try out Google Trends to explore rising topics and discover related searches. Try different variations of your topic in Google Trends to see what’s most popular or just explore whatever is trending now, like we did in this image:
Our team uses both BuzzSumo and Ahrefs Content Explorer to find content that already attracts backlinks and social engagement within our clients’ niches.
In Ahrefs, you can filter relevant articles by referring domains, organic traffic, and publication date to identify topics with a proven history of earning links.
Just go to Content Explorer, type in your niche, then add “infographic” after it and switch the right-hand filter to “In Title”:
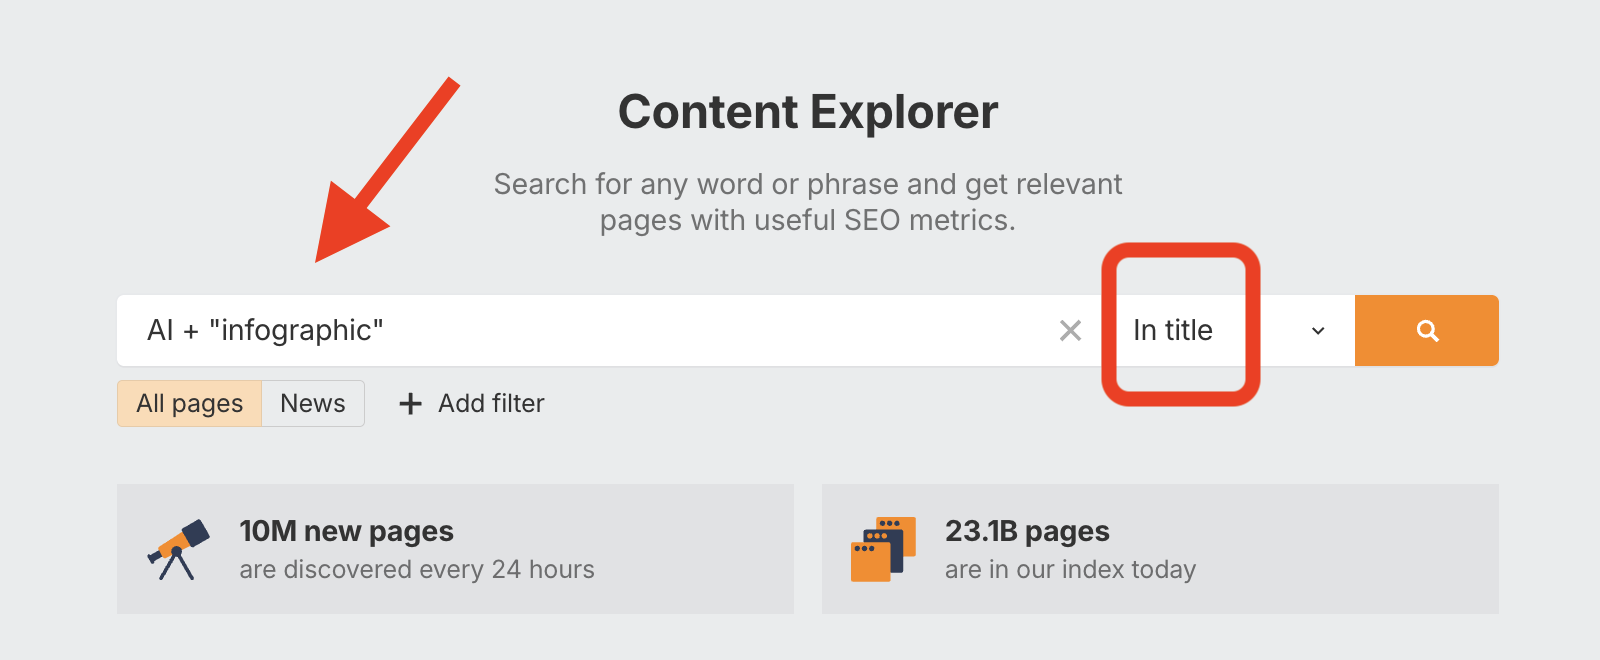
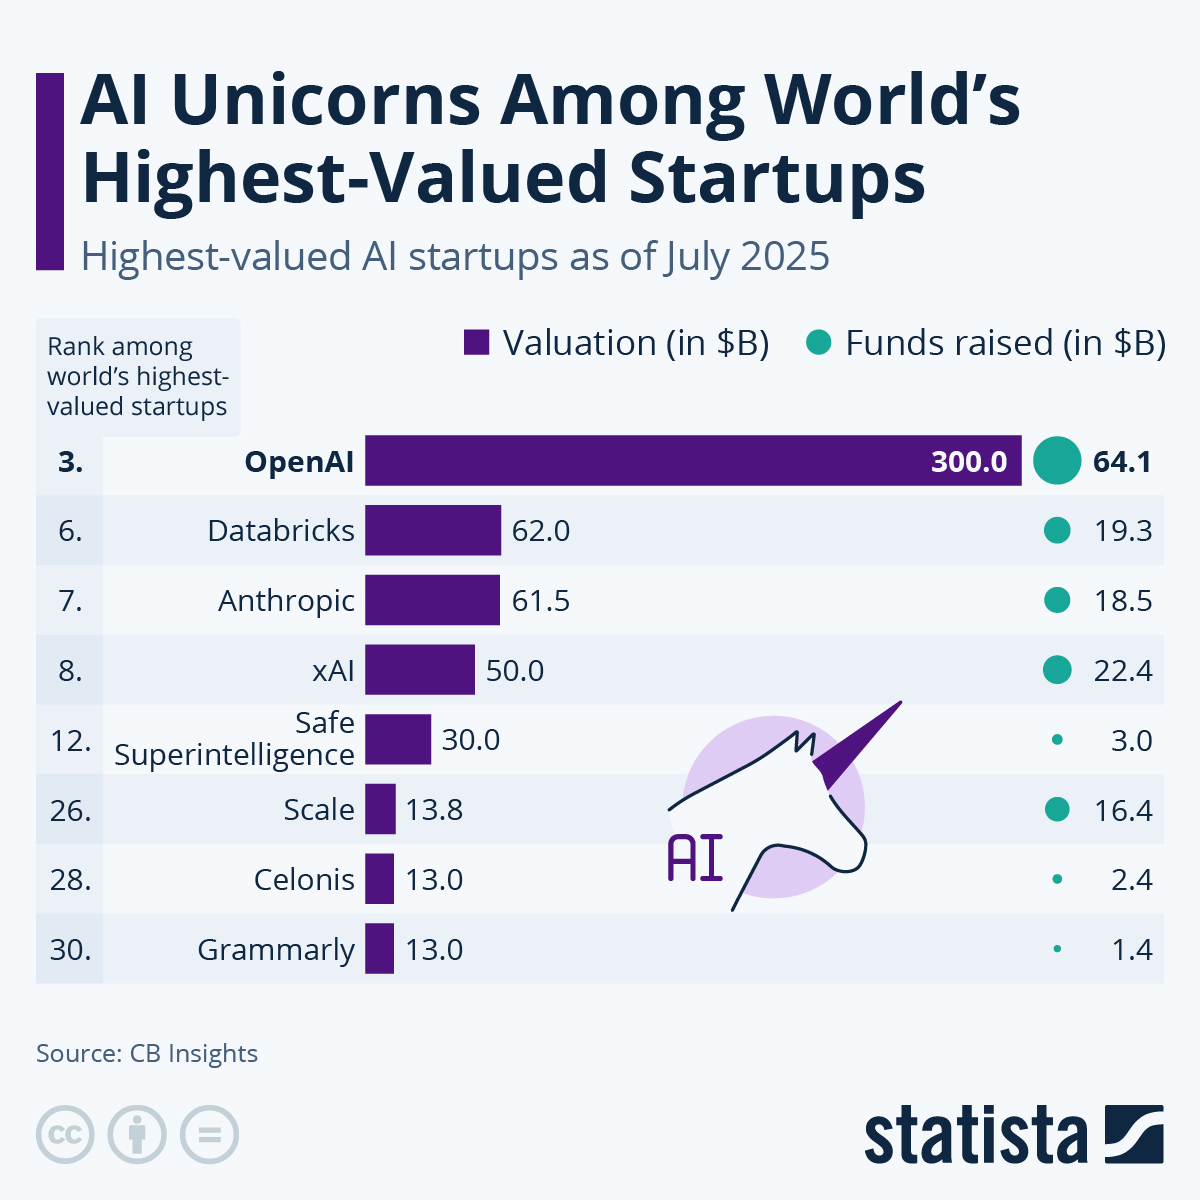
Then, you’ll get thousands of results for popular pages/articles around the web. All you have to do now is sort by referring domains and you’re set:

This simple chart infographic from Statista generated 27 backlinks:
And BuzzSumo is particularly useful for identifying widely shared content, trending topics, and articles that generate engagement across different platforms (it’s not cheap, though!).
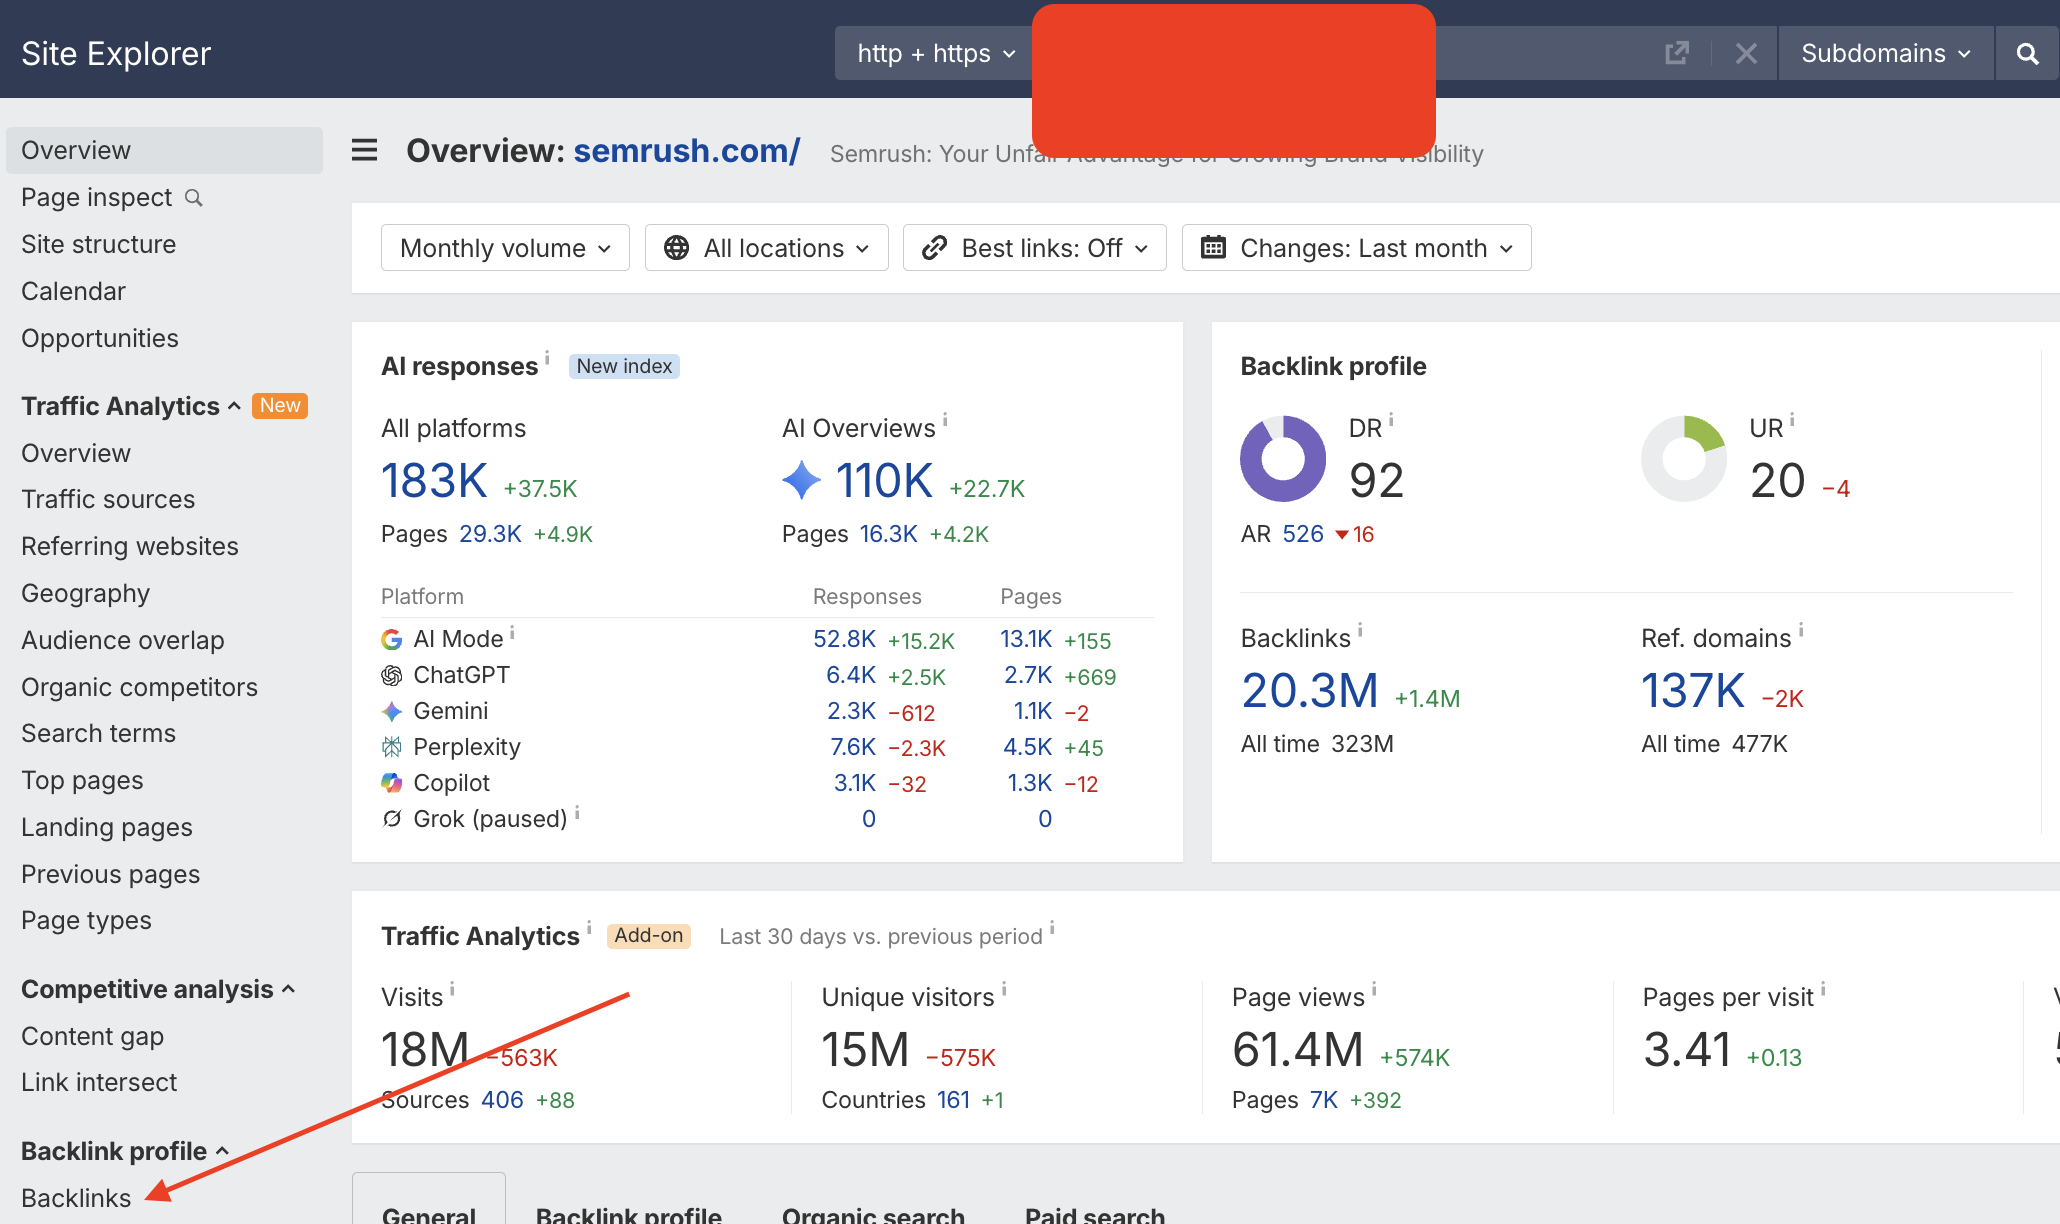
Another little trick is to run a competitor link analysis, starting with your competitors’ most-linked pages in Ahrefs Site Explorer:
Here’s what to do.
Pop your competitors into Ahrefs Site Explorer and click Backlinks on the left-hand side:
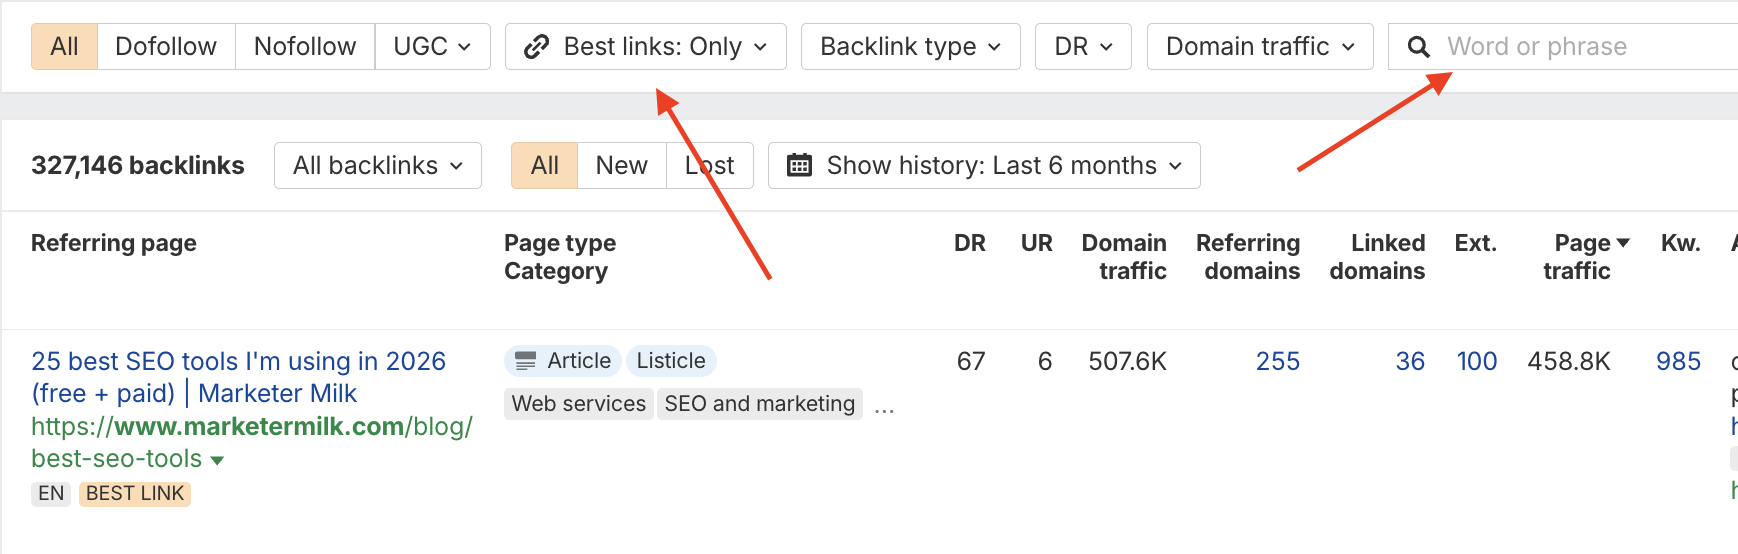
Then, sort by Best Links and look for the box that says Word or Phrase:
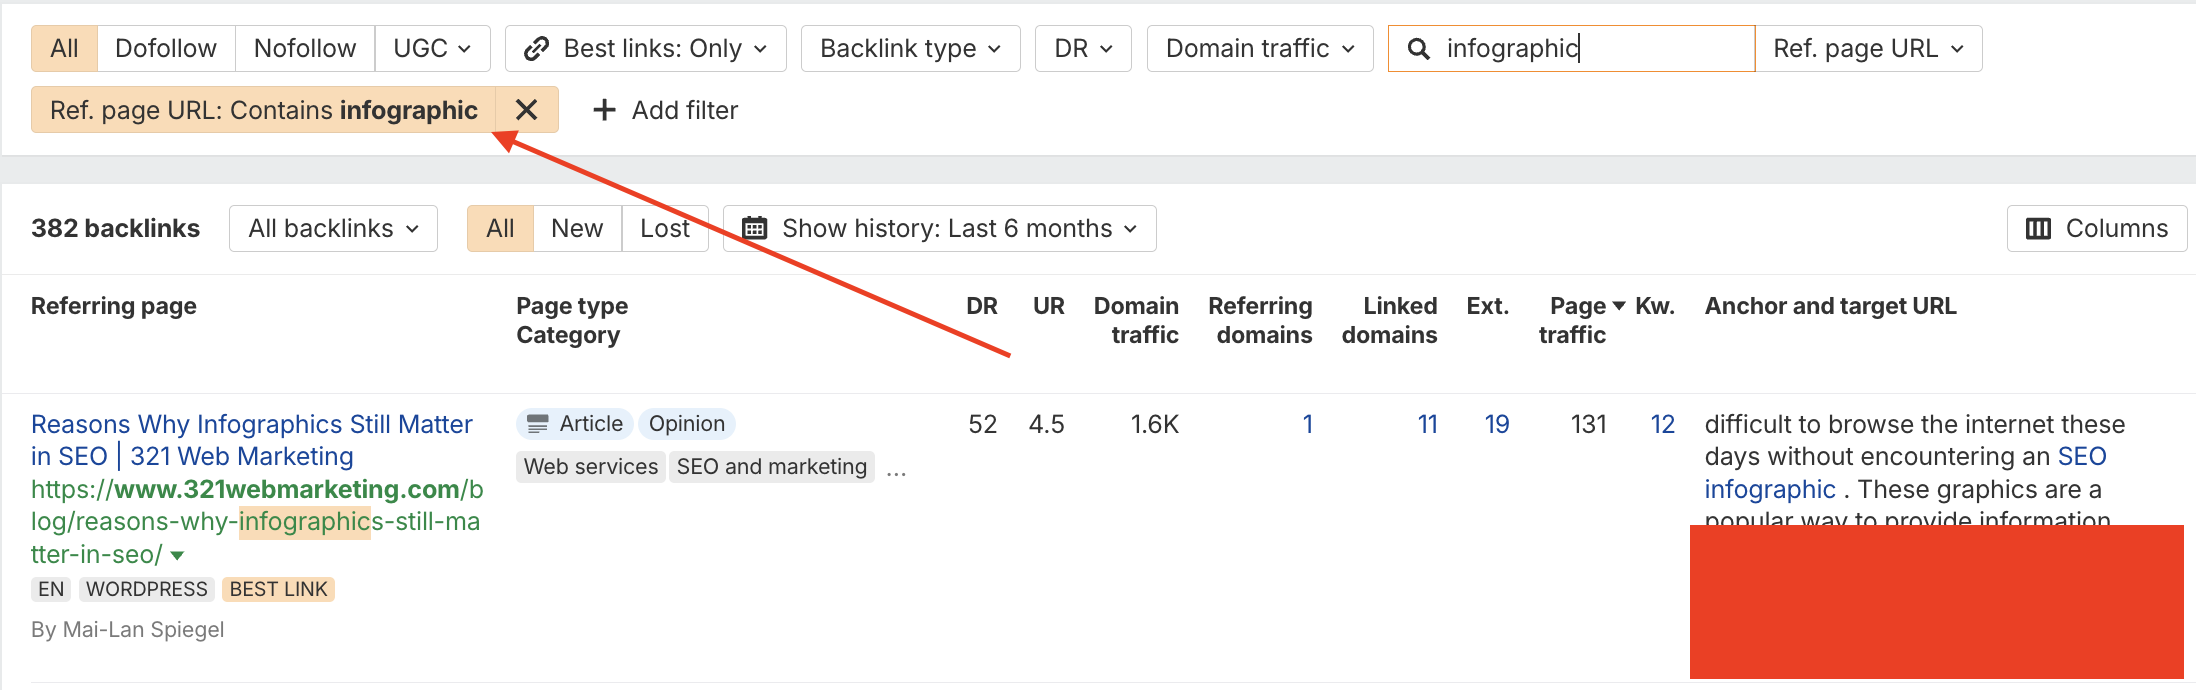
Type “infographic” into that box and you’ll see all of the backlinks your competitor has pointing to infographics on their site:
If a particular infographic or data-driven article has attracted plenty of referring domains, investigate what made it link-worthy.
But don’t just copy the idea. You’re better than that. Find a way to make it more useful, current, or original.
Source and Verify Your Data
Once you’ve settled on a topic, start collecting data to support it. Prioritize reliable sources like government databases, academic research, industry reports, and established organizations.
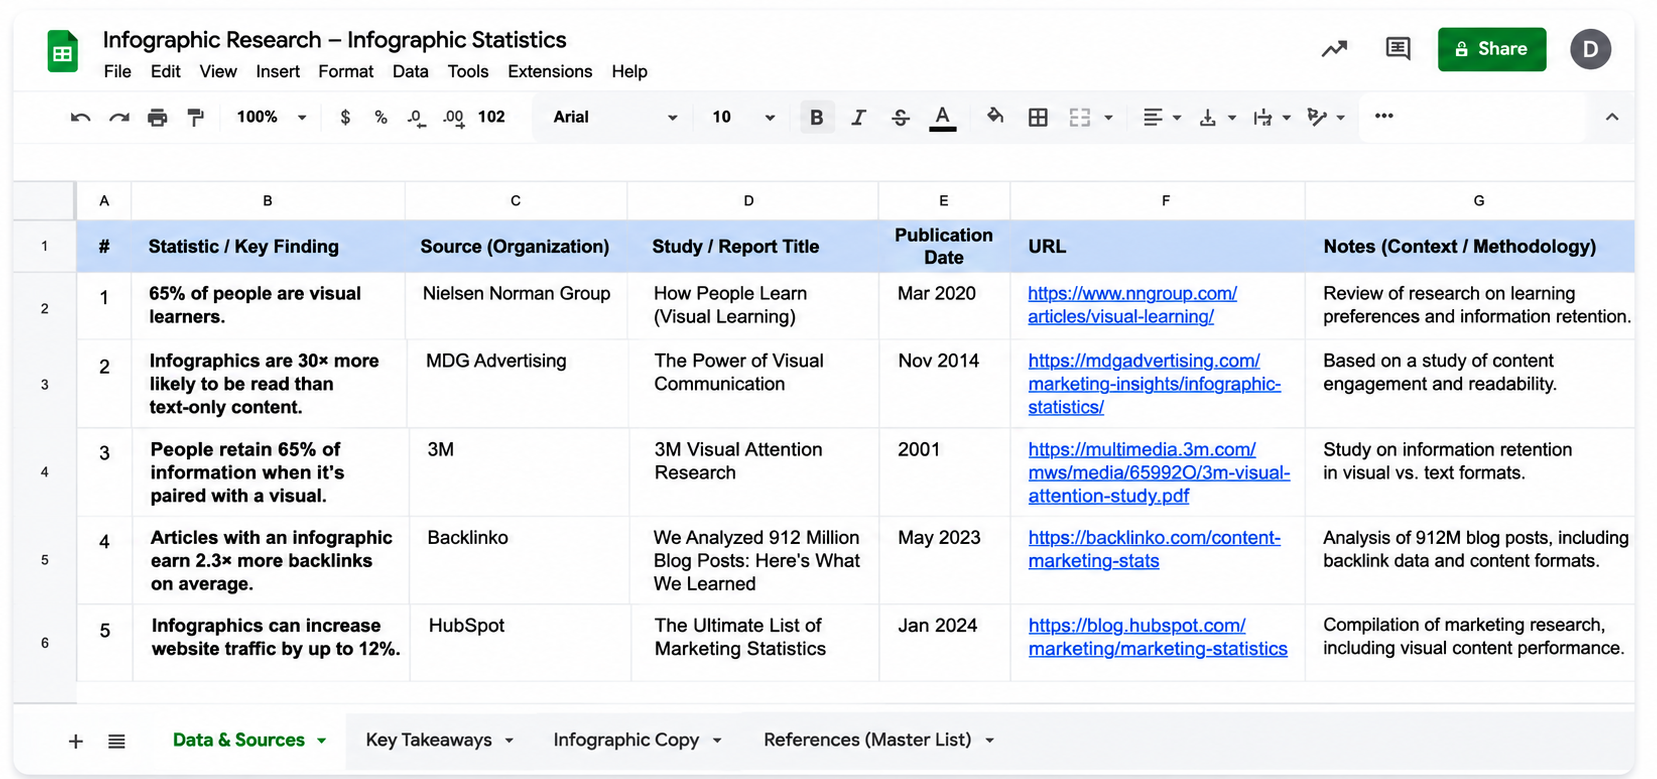
Our team’s process is in-depth but rather simple: open a spreadsheet and log every useful statistic you come across, along with its original source, study or report title, publication date, and URL. After you’ve done that, add notes about the context or methodology when needed.
This will give you a master list of verified data you can refer back to when creating future infographics or writing articles, instead of having to track down the same sources all over again.
Here’s an example of what it looks like by the end:
You can use your favorite AI tool to help you find research leads and organize datasets. But always verify important figures against the original source.
Of course, you’ll want to cite your sources, either in the infographic itself or the accompanying content so potential publishers can verify your claims.
Storyboard the Layout
Next up, storyboard your infographic’s design. You can just throw data into AI and build a graphic, but people are tired of AI slop.
Before opening Canva or Figma, decide how your infographic will tell its story.
Start by grouping your information into logical sections. Decide which statistics deserve the most attention, what the reader should understand first, and how each section connects to the next. Then sketch a rough layout, even if it’s just boxes and notes on paper.
A few practical tips:
- Give the infographic one clear central message.
- Put the most interesting statistic or finding near the top.
- Use a logical reading order, such as top to bottom or left to right.
- Avoid cramming every finding into one graphic. Split it into multiple sections if necessary.
- Plan where your sources, logo, and website URL will appear.
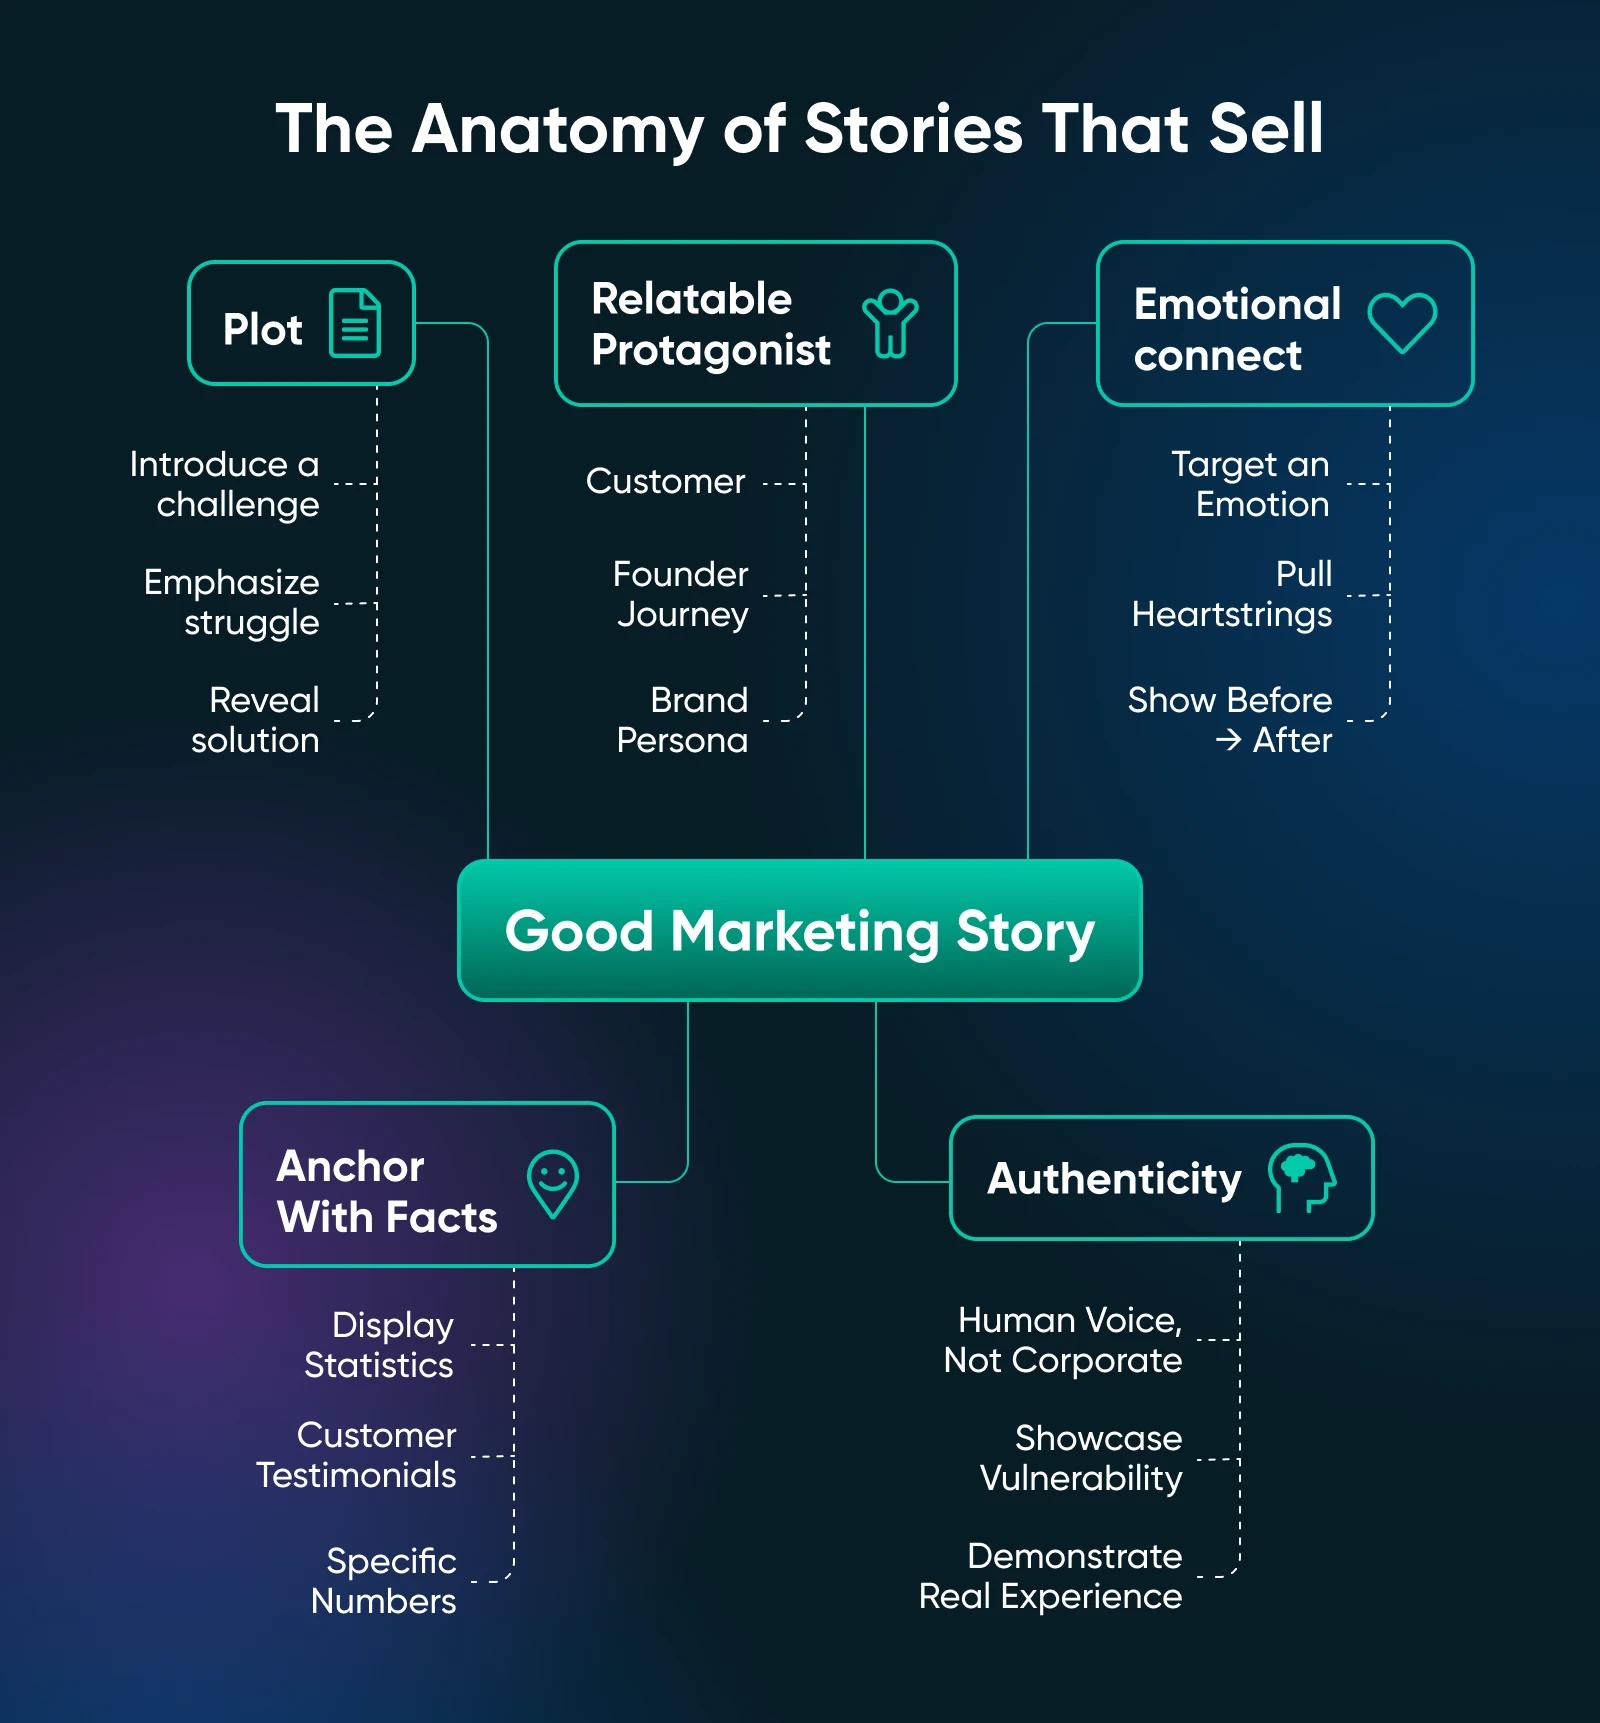
Here’s a good example of an infographic from Dream Host that tells a good story:
Design the Infographic
Now it’s time to turn your storyboard into an actual graphic.
You don’t need a professional graphic designer to get started. Tools like Canva, Figma, and Adobe Illustrator offer templates and design features that make creating visually appealing infographics accessible, even to the non-creatives.
Use two or three complementary colors, readable fonts, clear headings, and visual elements that actually help explain the information. Charts should be proportional to the data they represent, and illustrations should support the message, not distract from it.
A couple of extra tips: Use your brand colors to make the infographic recognizable and reinforce brand awareness. If you don’t have your color codes handy, a tool like Image Color Picker can help you extract them from your logo or website screenshots.
And as I already mentioned, you can also use AI to generate an infographic in a pinch, but I’d be careful with that approach. You need to put a lot of effort into constraining the model and ensuring the design comes out perfectly without recognizable AI artifacts.
If you’re going to use AI, make sure to use a prompt that sets guardrails, like this one:
Create a premium, professional B2B infographic using the following information:
Topic: [INSERT TOPIC]
Headline: [INSERT HEADLINE]
Data and key points:
[INSERT STATISTICS, FACTS, OR KEY INFORMATION]
Brand colors: [INSERT COLORS]
Brand name/logo: [INSERT BRAND]
- Premium B2B research report aesthetic inspired by Bloomberg, McKinsey, and modern SaaS analytics dashboards.
- Dark, sophisticated background with restrained brand-color accents.
- Flat, minimalist design with clean sans-serif typography, precise alignment, and generous whitespace.
- Use professional charts, comparison panels, or process diagrams where appropriate.
- Establish a clear visual hierarchy with prominent statistics and concise supporting text.
- Structure the infographic to tell a logical story: context → key findings → main takeaway.
- Choose the layout that best communicates the information rather than forcing a predefined structure.
- Use accurate data visualizations with properly scaled charts.
Avoid: Cartoonish graphics, neon glows, excessive gradients, 3D illustrations, oversized icons, decorative clutter, and unnecessary visual effects.
Format: Vertical 4:5.
Prioritize credibility, readability, visual storytelling, and polished editorial design. Preserve all facts and numerical values exactly. Do not invent statistics or unsupported claims.
Publish and Optimize the Page
Don’t just upload your infographic as an image and call it a day. Give it a dedicated page on your website so publishers have somewhere to link back to.
Follow these tips:
- Write a short introduction explaining what the infographic covers.
- Include the key findings in text and add relevant context for search engines.
- Optimize the page title, meta description, URL, and image alt text around your target keyword.
- Compress the image for faster loading while keeping the text clear and readable.
- Offer a downloadable, high-resolution version that other websites can use in their articles.
Automation tip: Ask Claude to help create a repeatable publishing checklist or a reusable Claude Skill that checks image dimensions, file size, alt text, metadata, source attribution, and page formatting before publication. This makes it easier to maintain consistent quality across future campaigns.
Add an Embed Code
Adding an embed code makes it easy for other websites to use your infographic. Instead of asking publishers to download the image, upload it, and figure out how to credit you, give them a ready-made embed code they can copy and paste.
Your embed code should include the infographic image, a link back to the original page and an attribution line. For example:
<a href="https://yourwebsite.com/infographic/">
  <img src="https://yourwebsite.com/images/infographic.png"
       alt="A descriptive infographic title">
</a>

<p>Source: <a href="https://yourwebsite.com/infographic/">
  Your Website
</a></p>
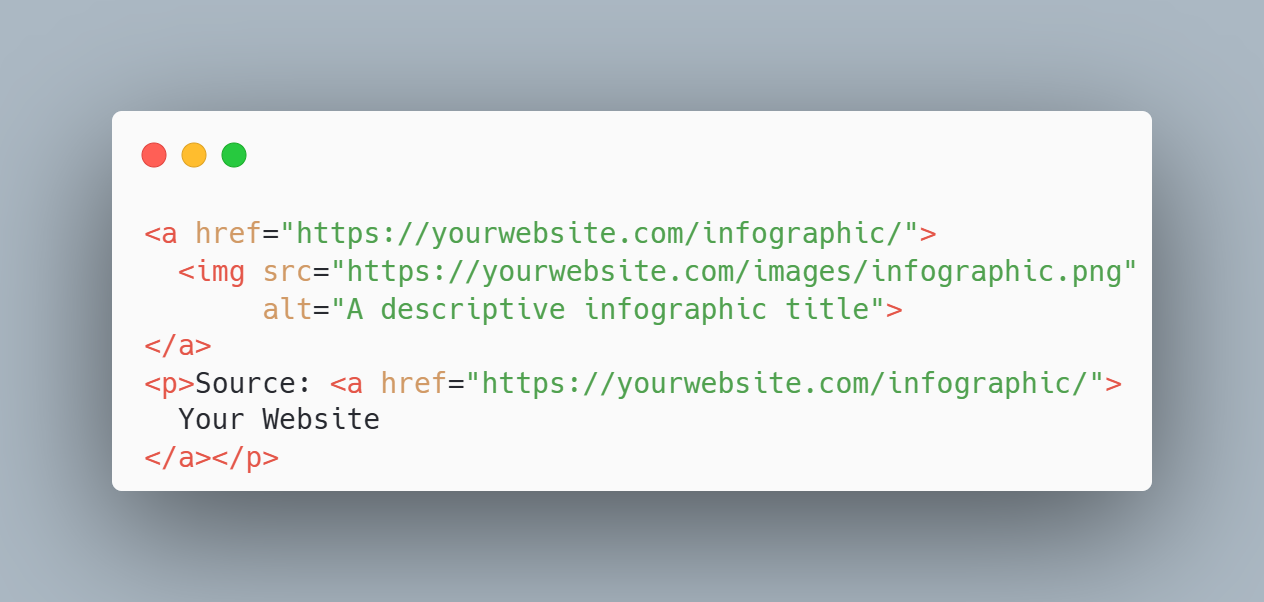
Place the code in a clearly labeled box underneath your infographic, along with a copy button, and make sure the image URL is publicly accessible and the code works when pasted into another website.
It’s a small step, but it makes it much easier for publishers to credit your original content.
Run Targeted Outreach and Promote
Your infographic is ready, but even the most useful visual asset won’t attract backlinks by itself. You need to put it in front of the right people and show them why it’s worth sharing.
Remember: You’re not begging for a backlink. You’re giving them something that makes their article better.
Here’s how to run an outreach campaign for infographic link building the right way:
1. Find Websites Already Using Infographics
Start by reverse engineering competitors and publishers in your niche.
Use Google search operators:
“your niche” “infographic”
“your topic” “infographic” -pinterest
intitle:infographic “your niche”
“your topic” “source:” “infographic”
site:competitor.com “infographic”
Then take the best-ranking infographics, drop their URLs into Ahrefs Site Explorer, and check their backlinks.
Those referring domains are your first outreach targets. They’ve already demonstrated that they’re willing to link to infographics.
I’d also find articles ranking for related informational keywords that could benefit from an infographic but don’t currently include one.
Pro Tip: You can also use Ahrefs to find the websites that link to your competitors’ infographics the most.
2. Build a Targeted Prospect List
Next, split your outreach targets into three groups:
- Existing infographic directories and linkers: Websites that have already embedded or cited similar infographics.
- Relevant content publishers: Bloggers, educational websites, industry publications, and resource pages covering your exact topic.
- Journalists and niche authorities: People who regularly publish research, statistics, industry news, and data-driven articles.
When you find their contact information, throw them all into a sheet and start identifying the highest-ROI targets.
Prioritize topical relevance, genuine organic visibility, and contextual link opportunities over DR alone.
3. Personalize Your Outreach
Don’t send 2,000 emails saying you’ve made an awesome infographic.
Find a specific article, identify where your graphic adds value, and explain why it’s worth including.
Whatever you do, DO NOT do the typical “I just happened to find your website” BS. Nobody falls for it anymore. Just be direct and friendly. We all know that everyone is looking for backlinks.
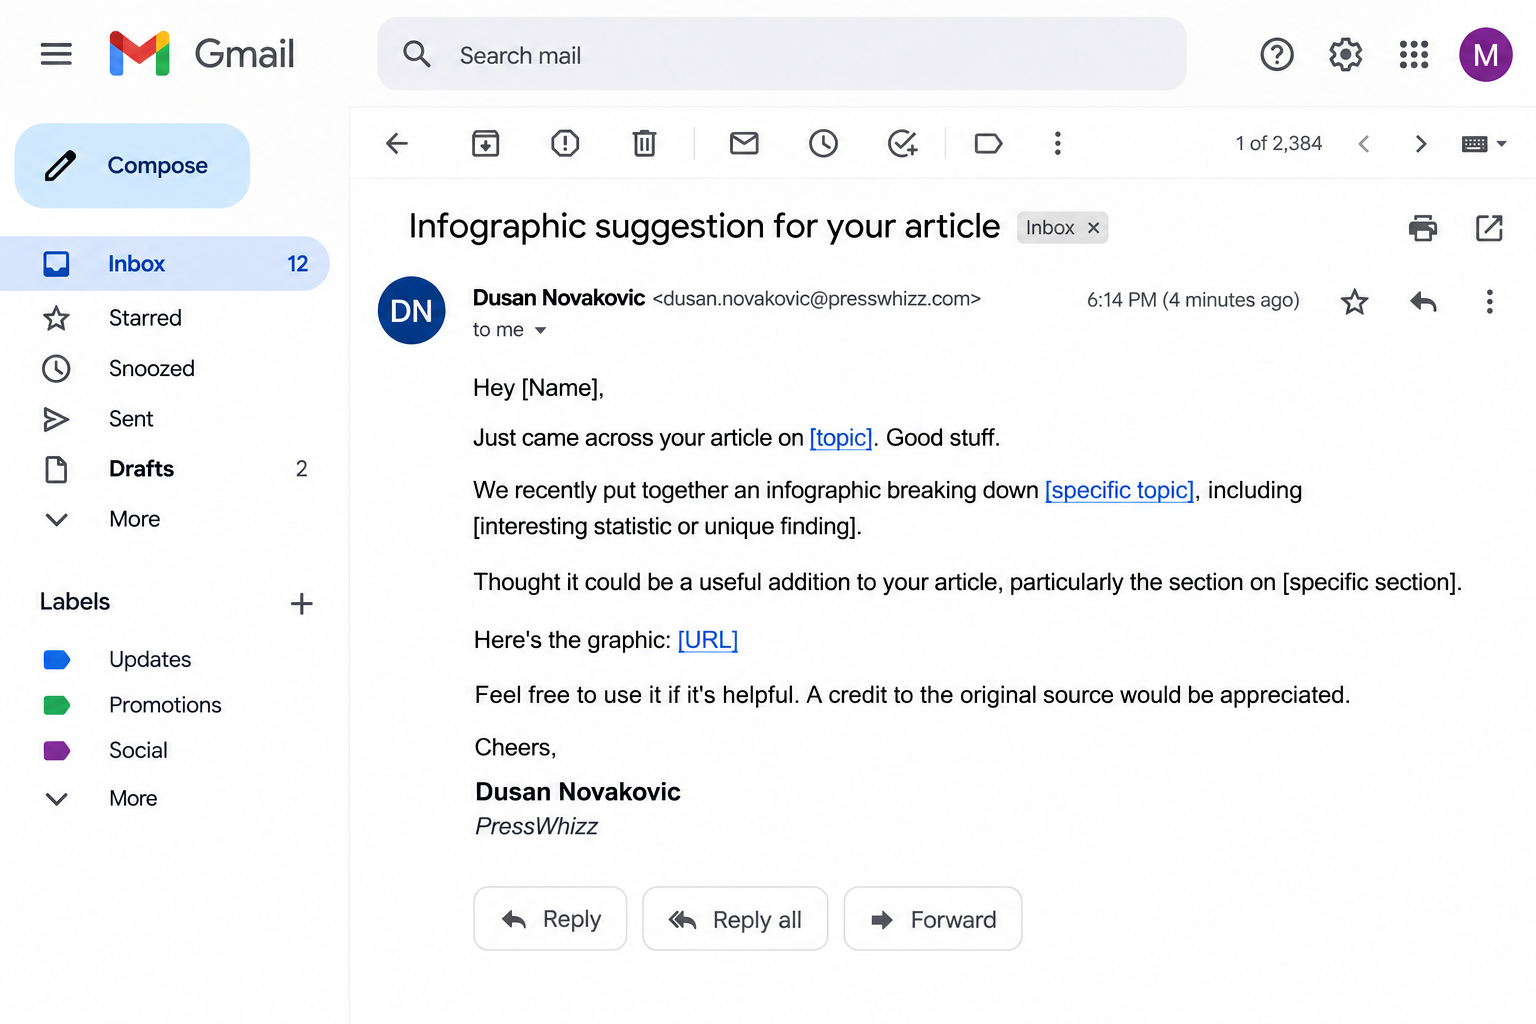
Here’s how I’d pitch it:
Hey [Name],
Just came across your article on [topic]. Good stuff.
We recently put together an infographic breaking down [specific topic], including [interesting statistic or unique finding].
Thought it could be a useful addition to your article, particularly the section on [specific section].
Here’s the graphic: [URL]
Feel free to use it if it’s helpful. A credit to the original source would be appreciated.
Cheers,
[Name]
If you really want to take things to the next level, you can automate mass outreach using a combination of Pitchbox and Claude Skills or even ChatGPT skills. You can use AI to automate most of the process and still have personalized outreach that doesn’t feel like AI.
Here’s how:
- Use Pitchbox to find relevant websites, collect contact information, and organize prospects into campaigns
- Export your prospect list and run the sites through GPT or Claude to research what they cover, who their audience is, and what they’ve published recently
- Generate personalized email intros, subject lines, and pitches based on that research instead of blasting generic templates
- Import the AI-generated copy back into Pitchbox and plug it into your outreach sequences
- Track reply rates and conversions inside Pitchbox to refine your approach over time
Worth noting: These tools don’t natively talk to each other. You’ll need to build the connection yourself, whether that’s through scripts, Sheets, Zapier, or something similar. Pitchbox handles the outreach mechanics, AI handles making your emails actually sound personal, and you handle the glue in between. It’s a real workflow that gets results, but it’s not plug-and-play.
Infographic Link Building vs. Other Link Building Methods
Before we wrap up, we just want to compare infographic link building to other forms of link building so you can get an idea of how valuable infographics can be for your business.
We always recommend that you think with a “money hat” or “ROI hat” approach to SEO. Whatever provides the best return on investment and makes the most money is where you should focus. Infographics are great, but maybe you want to combine them with other strategies to increase your ROI.
Infographics earn links over time, but you’re waiting on outreach replies, and that takes weeks. If you want links sooner and have the budget for it, we run three methods that work faster.
Digital PR
Digital PR means pitching newsworthy stories, original data, or expert commentary to journalists and publishers. When a publication runs your story, you earn a link from a news or industry site, often with strong authority. Of course, most of us just buy links now. Why not? They work.
In Editorial.link’s survey of 518 SEO professionals, 48.6% rated digital PR the most effective link-building tactic, ahead of guest posting at 16%.
Guest Posts
With guest posts, you write an original article for a site in your niche and place a link back to your own. You get the link in editorial context plus exposure to that site’s audience. Expect a slower timeline than niche edits, since the site has to review, edit, and schedule your article, but SEOs usually prefer guest posts because they pick the topic, the angle, and the anchor text.
Further Reading: If you’re interested in building guest post backlinks on your own, check out our guide on how to do guest post outreach properly.
Niche Edits
Niche edits, also called link insertions, add your link to an article that’s already published and indexed. The page has history and traffic from day one, so these usually go live the fastest of the three. If speed is your priority, I’d start here.
Other Types of Link Building
We recommend checking out a few of our other articles on different link building strategies to get a better feel for the entire link building tactic universe. You might find some tactics more valuable than others:
- Guest Post Link Building
- Guest Posts vs. Niche Edits
- Link insertions
- Link exchanges
- Tiered link building
- Black hat link building
- .Edu link building
- Link reclamation
- Testimonial link building
- Guestographic link building
- Scholarship link building
- Forum links
Closing Thoughts
Infographic link building is a high-ROI link building strategy that can generate dozens of backlinks for your website when done properly.
Whenever you present interesting information in an engaging format that’s easily readable, digestible, and shareable, you improve your chances of building good backlinks. And when you get those hard-to-replicate links from websites that truly believe your content is linkworthy, you improve your search engine rankings.
Building infographic links isn’t “hard”. It’s just time-consuming. You have to pick the right targets, analyze their sites, find their information, and reach out to them using emails that don’t sound like templated AI slop. And we didn’t even mention making the infographics yet!
Whether you choose to outsource link building to a link building services provider or do it in-house, I suggest you work infographic link building into your strategy.
As always, I wish you luck.
– Dusan Novakovic